7/30/2024
Topic:
6-7. Model Tools and Deleting Models
Kiki WagnerAdministrator Posts: 33
|

Model Tools
Allows you to export the FWP and DMS diagnostics to Excel to investigate any errors or issues that can occur when running a model and can be very useful with troubleshooting such as mismatching of information columns – FWP vs DMS. The file provides the following sheets:
- Information summary
- Information on Data
- Named Ranges
- Parameter information
- Treatment information.

Deleting Model
Allows you to delete the model selected at the top of the Model Management page.
edited by Kiki on 7/30/2024
|
|
|
7/30/2024
Topic:
5. Manage Model Data
Kiki WagnerAdministrator Posts: 33
|

This section allows you to manage the data related to the deterioration model that you are running. On the top, you have the different tabs available for the different deterioration model types:
§ Budget
§ Treatment Cost
§ Committed Treatments
§ Treatment Target Quantities
§ KPI Data
For more information on the different modelling options and types, to the following help posts:
§ Deterioration Modelling > Manage Model Data: Budgets Help post
§ Deterioration Modelling > Grouped, Ranked, Cost-Constrained Model
§ Deterioration Modelling > KPI Constrained Models in JunoViewer
§ Deterioration Modelling > Using A trigger Horizon for Strategy generation
|
|
|
7/30/2024
Topic:
4. Manage DMS Files
Kiki WagnerAdministrator Posts: 33
|
Because DMS files can contain sensitive information, the management of these files are important. DMS files can only be uploaded under this section (DMS files are not uploaded to the cloud and then added to the database as with the rest of the data in JunoViewer). All the DMS files will be available for a selected network will be in the DMS file grid and once you select a file, it will appear in red. A selected DMS file can be downloaded, deleted or managed.
DMS files can only be uploaded and managed by administrator and account administrator users. You can set the DMS to private – which means that only you will be able to view the DMS, or you can set the permissions and select individuals with their desired permissions.
Important: If you do not have permissions to a DMS file, you will not be able to view it in the DMS files list.

The Manage DMS Permissions functionality enables you to ensure the often-confidential information within your DMS file is only accessible to specific Administrator or Network Administrator users within your account.
There are two types of permissions available:
Owner
Download Only
The flowchart below explains the workflow and functionality available for each:

The Manage DMS Permissions functionality is available in the Model Management page (under the Modelling menu) during the DMS upload process and can also be accessed via the Manage DMS File button for existing DMS files. The images below provide further details.
Pop-up when permission is set to Private, uploading a new DMS file (or when opened for the first time):

When a new DMS file is uploaded, the Set DMS Permissions window will appear. The user can set the DMS permissions to Private where only the person uploading the DMS will have permissions to download, delete, replace and manage the DMS file or select Set Permissions where the user can select Administrator and Network Administrator users to have permissions to the DMS file. If the user clicks on Close on the 'Set DMS Permissions' window, the following message will appear: " If you close the Manage DMS Permissions pop-up your DMS will not be uploaded. Do you want to proceed?"
Pop-up when Set Permissions is selected:
When a newly added Administrator or Network Administrator user requires access to a DMS, an owner will need to manually add them via the pop-up (i.e. they will not be automatically be given access to any DMS files).
DMS security report
Users can download the DMS security report which gives a list of the DMS files and user permissions as well as the DMS activity.

edited by Kiki on 9/25/2024
|
|
|
7/30/2024
Topic:
3. Manage Model Setup
Kiki WagnerAdministrator Posts: 33
|
The model setup is created by going to the Add New Setup arrow under the manage model setup section. Data Managers and Administrator users can add and edit Model Setup Functionality.
- Select the Network and the FWP you want to model
- You also get the opportunity to give the FWP a different label
- Select the DMS file called
- The rest of the options are for Modelling purposes, instead of using the budget treatment cost, and committed treatments from the DMS file, select from versions uploaded via the Manage Models page

Similarly, you can edit your selected setup by clicking on the edit selected setup arrow. Note that if you have pending changes that should go through the approval process, you would not be able to edit the selected setup.
edited by Kiki on 9/25/2024
|
|
|
7/30/2024
Topic:
2. Running Models
Kiki WagnerAdministrator Posts: 33
|

When you are running a model, the first step is to click on pre-check setup – this will do all the basic checks to ensure that your model setup is correct. Once you have completed the pre-check setup, you can run the model.
Clearing Treatments

NOTE: This only applies if you are running a model that triggers treatments using one of the treatment assignment modes other than "none". If you are pre-importing treatments and simply running a forecast model without triggering any treatments, then this post does not apply to your model.
When you are setting up and testing a trigger based model, you will often find that you want to make tweaks and corrections to your trigger equations in the DMS setup file. Each time you make such changes, you will need to upload the modified DMS setup file and re-run the model. However, since your FWP now already contains treatments triggered in the previous model run, you will need to first remove the treatments that were assigned in the earlier model run.
You can do this by going to the Model Management Page > Run Models and after selecting the model that you would like to run, click on the Clear Treatments button
Running a model creates a Long Running Process. The progression of this can be tracked on the Long Running Processes Screen which is available underneath the avatar on the right side of the top menu bar.

Once the model run has completed, you can view the FWP at FWP -> Forecast View and you can download the model report also from the Forecast View.
Tracking Model Progress and Using Logs
A full model report is also generated as part of your model run. You can conveniently download this model report when your model is done using the LRP log feature, as explained below.
How to use the LRP Logs in your model runs:
Select your model run in the LRP list, and click on Show Logs. See figure below for details

During a model run, two files are automatically generated: (a) a Full Model Output Report; and (b) the LRP event log in Excel format. For certain model types, additional information may be available depending on your model debug setup. For example, in BCA model runs, you can request the model to generate an Excel file of all treatment strategies. To use this feature, Lonrix needs to modify the "debug Setup" XML information associated with your account. Talk to Lonrix about setting this up for your needs.
To view all downloadable files associated with your model run, check the box labelled ‘Show only downloadable files’. This will show a list of all files generated during your model run, as shown below.

Advanced Features
The model Logs can be extremely useful to debug and track progress of your model. An advanced feature of the Model LRP Log is to track the values of one or more cells in your DMS for a specific model segment. Please refer to Advanced Model Debugging under Modelling Process Help post for more information
|
|
|
7/30/2024
Topic:
1. Viewing of Models
Kiki WagnerAdministrator Posts: 33
|
The first part of the Model Management page is where you can see all the available models for the selected network. Each model consists of the specified FWP (Forward Works Programme) and associated DMS (Deterioration Model Setup) file. You can also see if your model has been run and when was the last run date as well as if the model is locked or unlocked. It is important to note that only once a model has been run, the results will be available to view in the forecast view. The different parts of a model run are shown in the schematic figure below:

Each model has a model information popup that can be accessed by clicking on the ‘i’ in the last column that contains useful model information.

The link between your FWPs and the DMS file
In this section, we take a closer look at the FWP definition and explain the relationship between a FWP and a deterioration model setup file. This relationship needs to be understood very well before you can attempt to do deterioration modelling with JunoViewer Web.
For JunoViewer Web administrators, the following points need to be understood and memorized:
- A FWP must belong to a network, and each network can have more than one FWP.
- Different FWP’s linked to a network can represent different versions of the same FWP, or it could represent work plans associated with different maintenance aspects (e.g. one dealing with road works and another with vegetation control).
- Each version of a FWP is regarded as a separate plan. There is no formal or model linkage between two versions of the same FWP.
- Each specific version of a FWP can have only one Deterioration Model Setup (DMS) file associated with it.
- A single DMS file can be used across different FWPs (normally called a 'Master DMS')
- Before you can use the Forecast View, you need to create an association between the FWP you want to see, and the model that is linked to that FWP.
Some of the above concepts are illustrated schematically in this figure:

Locking and unlocking of a model
A model will be locked, when the associated FWP has been downloaded as an editable version. It will be unlocked once the offline database containing the editable FWP has been synced back and all pending changes have been approved and agreed.
edited by Kiki on 7/30/2024
|
|
|
7/30/2024
Topic:
Model Management Page Help Series
Kiki WagnerAdministrator Posts: 33
|
The Model Management Help series will explain all the functionality that you can access from the FWP – FWP Management page in JunoViewer which contains a few main sections as depicted in the image below.
- View Models
- Run Models
- Manage Model Setup
- Manage DMS Files
- Manage Model Data
- Model Tools
- Delete Model


|
|
|
1/10/2024
Topic:
Map View
Kiki WagnerAdministrator Posts: 33
|
Kiki WagnerAdministrator Posts: 33
Topic: Map View
Accessing the Map View
The Map View can be accessed from the Analyse - Map View menu. To optimise your screen real-estate for the Map View, you can change the zoom level on your Chrome Browser:
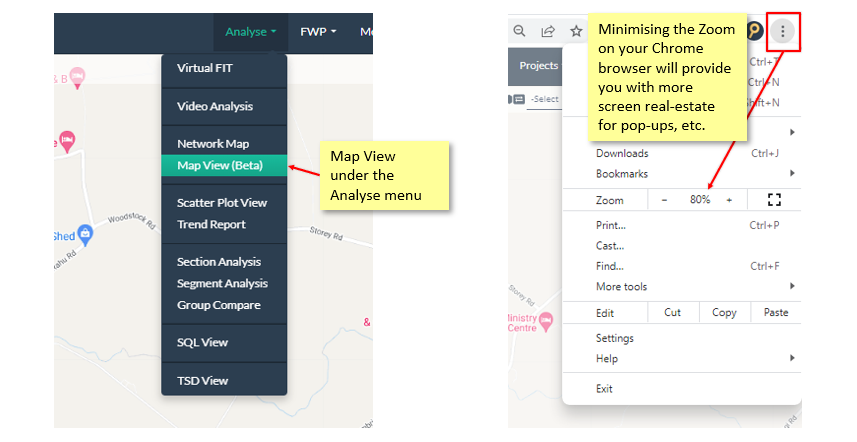
This is a powerful tool, allowing users to view and analyse multiple views simultaneously. In the background, you have the Map to which you can add layers representing various assets, treatment, notes, photos etc. These layers can be customised to meet your requirements by deciding which layers to view as well as the road sections and sub-sections to include in the view.
Map view layout structure
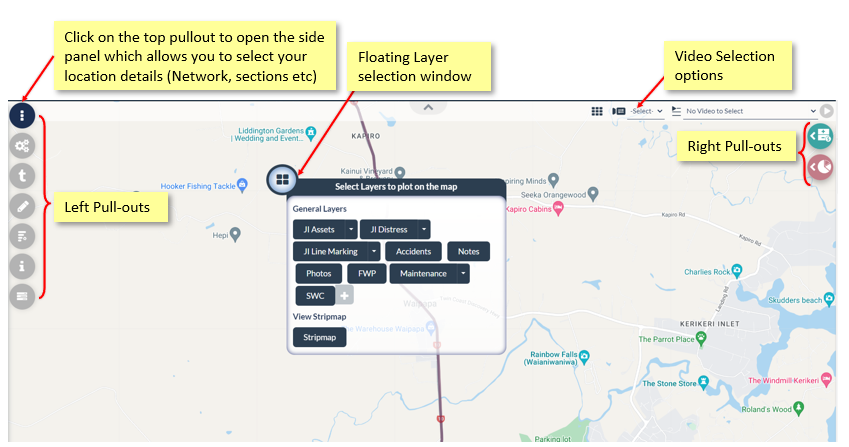
On the left and right side of the screen, you have the pull-out menu as well as a floating Layer selection window that the user can move around or minimize by double clicking on the four squares on the top left of the floating window. In the top Right of the Map View, you have the video selection options.
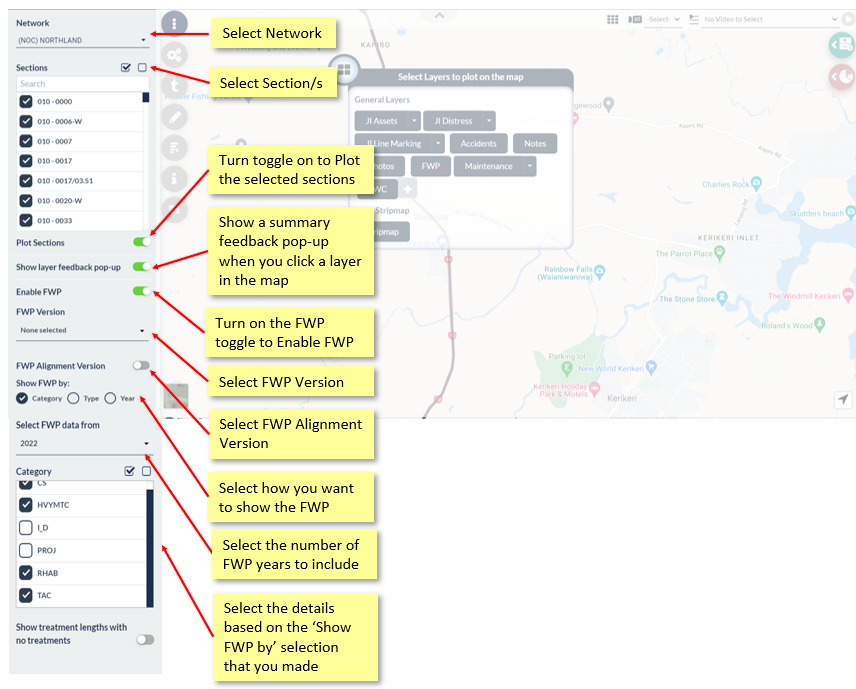
Setting up your Map View
- Start by clicking on the pullout with the three vertical dots towards the leftmost top of the screen which will open the Map location and FWP settings side panel
- Select your Network and Sections
- Turn the Plot sections toggle on to view selected sections on the Map
- Enable your FWP. Once you have turned on the FWP enabling toggle, you will see the options to select your FWP version as well as the FWP viewing options
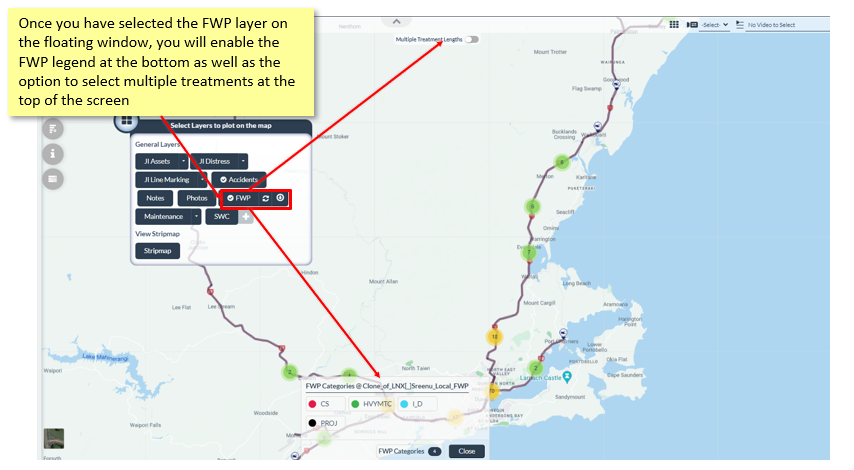
Floating window
Open your floating layer selection window by double clicking on the icon (close the window by doing the same) select the layers that you would like to add to your view.
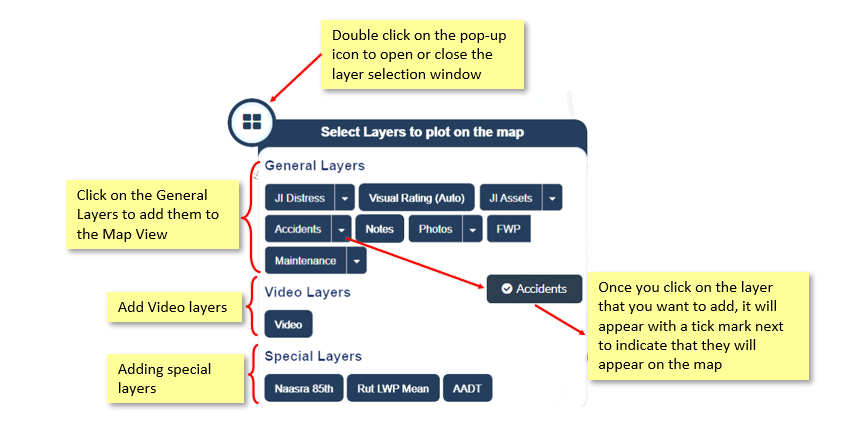
When you select the FWP layer in your Floating window to plot on the Map, you will enable the Multiple treatment length selection option at the top of the screen as well as the FWP legend at the bottom of the screen.
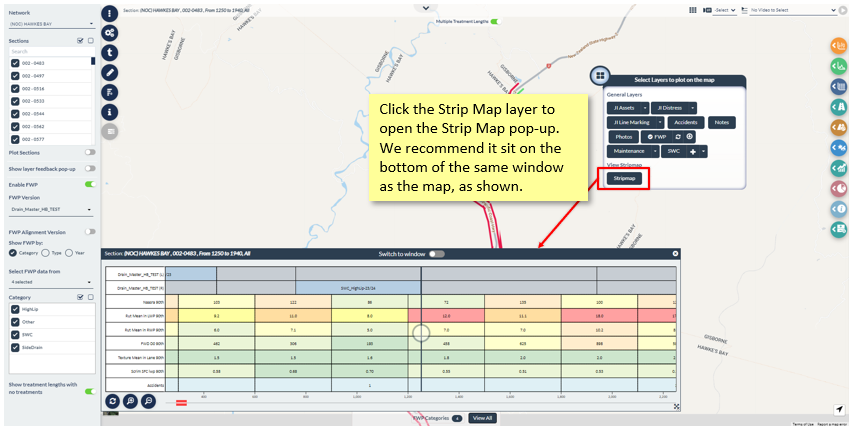
Stripmap
You also have the ability to add the StripMap onto your view by clicking on the Stripmap layer on your floating window and drag it to a suitable position.
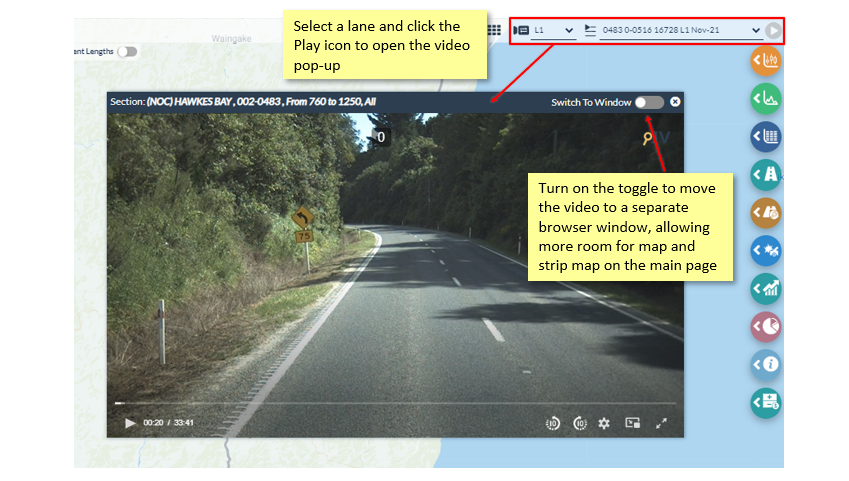
Video
On the top right corner, select the lane and click the play icon to open the video pop-up and use the toggle option to move the video to a separate browser window to allow more room for the viewing of your main page.
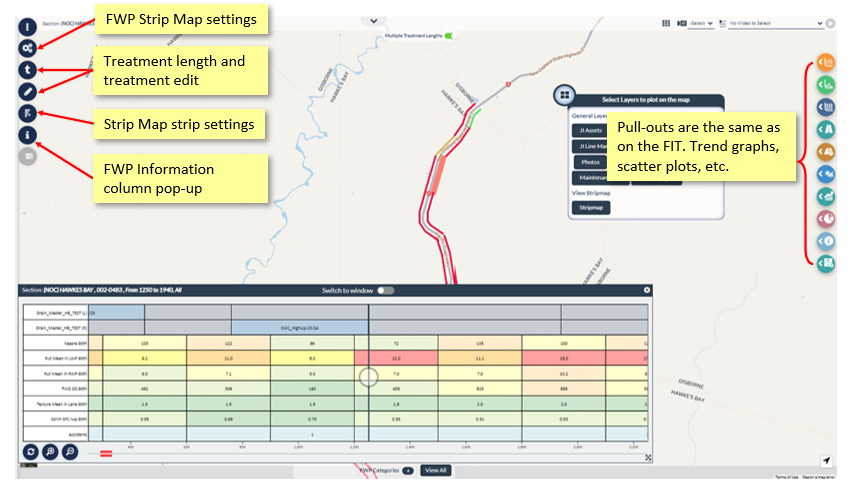
Pullouts
The pullout menus on the left side of the screen are similar to those of the Virtual FIT. Please refer to Virtual FIT help series for Strip map pullout information.
edited by Kiki on 1/10/2024
|
|
|
1/9/2024
Topic:
4. FWP Tools
Kiki WagnerAdministrator Posts: 33
|
The FWP tools section has 5 subsections:
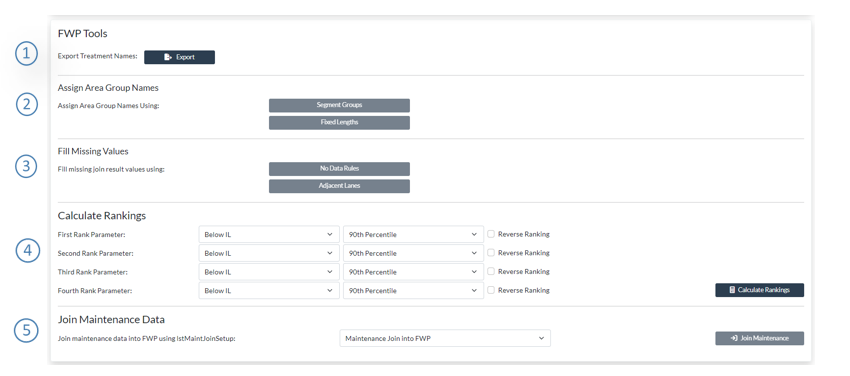
Export treatment names
The Export Treatment Names functionality under the FWP tools section in the FWP Management page enables you to derive the treatment names from your FWP. The output will be an excel file with the distinct treatment names contained in your FWP
Assign area Group Names
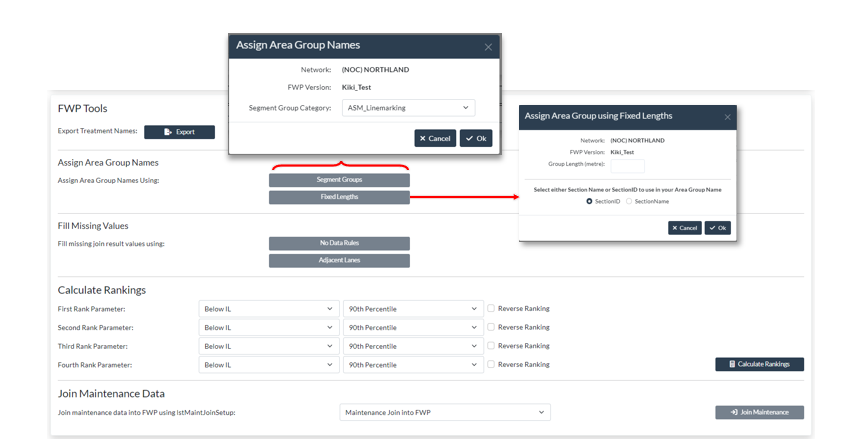
You can assign an area group name by Segment Group Category or by using fixed lengths. If you click on the Segment groups option.
Fill missing Values
One of the key challenges in deterioration modelling is the handling of missing data on join segments, or - in the case of FWP pre-processing, modelling segments. This is often a problem on networks where condition is not often performed in certain lanes (e.g. fast lanes on free ways), and yet the model needs to take these segments into account. Because of the realities of network level data collection, the result of the automated data join (previous section), may often look like that shown in the figure below:

If this set of data is used as a basis for the deterioration model, errors may result if proper default values are not assigned. Although JunoViewer Web’s deterioration model allows you to assign default values as part of the model initialization process, the model set pre-processing algorithm contains a more flexible and powerful approach to handling missing data values.
In this approach, missing values on a segment are handled in three stages, or levels, as shown by the figure below. It should be noted that this process is applied on each Join Parameter data type, which is normally represented by a specific source table and column:
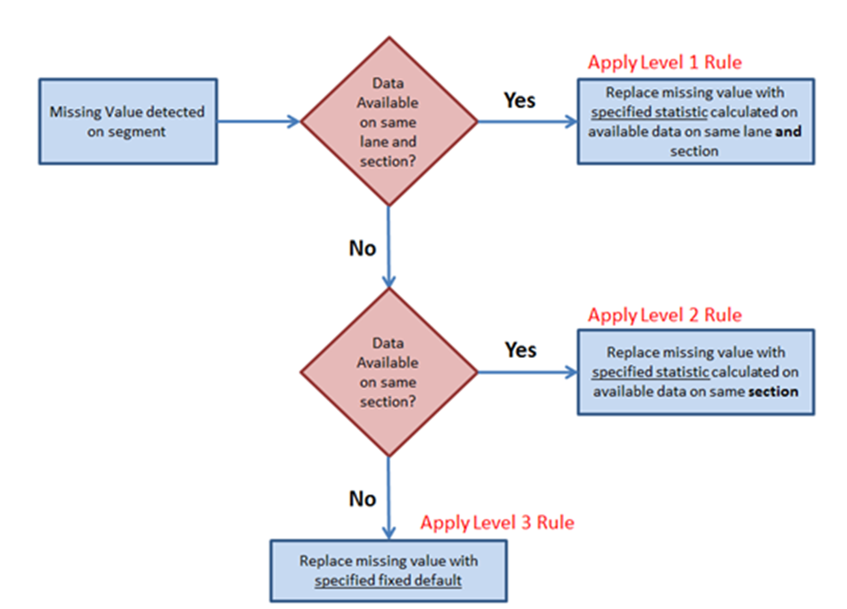
As can be seen from the figure above, the completion of missing values proceeds in three steps. First, the model checks whether there is any data available for the current segment’s lane and section. If so, then this data is used to calculate a specified statistic (e.g. 80th percentile), and this value is then used as a surrogate to replace the missing value.
If no data is found for the specified lane and section, the process falls down a level and checks if there is any data available on the same section, without taking lanes into consideration. If some data is found, then this data is used to calculate a specified percentile which is then used as a surrogate to replace the missing value. If no data is found for the current data type on the entire section, then the algorithm has no choice but to apply a specified fixed default value.
To specify the statistics to use for each of these three levels, you need to click on the No Data Rules button when editing Join Parameter properties (see the Join Parameter page under the settings menu).
When you perform a Data Join and fold the results into an existing FWP, JunoViewer gives you an option to assign values to segments in your FWP for which there is no data available. The logic for filling in such missing data provides for three levels. The first level is the most sophisticated and looks for Join Result data on the same section and lane. Using such data (if any is found) a specified statistic is then calculated using the available join data on the same section and lane, and this statistic value is assigned to all segments with the "No Data" flag (indicating that the Data Join could not find any data on that segment).
Handling No Data in Join Results – Level 1
The image below shows a Level 1 No Data Rule which specifies that, for segments with No Data, the Mean Value on available join results on the same section and lane should be used:

The figure below shows how this Level 1 No Data Rule will be applied by JunoViewer for a Join Parameter called "Rut_80th" (representing the 80th percentile Rut Depth on each join segment):

In this figure, you can see that lane L1 has data on all segments for Section A (sectionID = 1). However, some segments of lane L2 have no data available, and thus the Join Results put a No Data flag on these segments (highlighted in yellow). Since the Level 1 No Data rule says "use the Mean Value of any join segments on the same section and lane", we calculate the Mean Value of the join results using only those segments on the same section and lane. In this example, this means we take the average of 7.2 and 4.3 (available values on lane L2 on Section A, shown in red). The average is 5.75, and is filled into the cells on this section where the No Data flag is found.
If none of the segments on Section A Lane 2 have valid data, then the No Data algorithm will automatically fall through to the Level 2 No Data rule.
Handling No Data in Join Results – Level 2:
When you perform a Data Join and fold the results into an existing FWP, JunoViewer gives you an option to assign values to segments in your FWP for which there is no data available. The logic for filling in such missing data provides for three levels. The first level is the most sophisticated, and looks for Join Result data on the same section and lane. The second level uses only those Join Results found on the same Section, regardless of lane. The Level 2 No Data rule is automatically applied for any segment where the Level 1 rule did not yield any result (i.e. still no data found).
The image below shows a Level 2 No Data Rule which specifies that, for segments with No Data, the Mean Value on available join results on the same section should be used:

The figure below shows how this Level 1 No Data Rule will be applied by JunoViewer for a Join Parameter called "Rut_80th" (representing the 80th percentile Rut Depth on each join segment):

In this figure, you can see that lane L1 has data on all segments for Section A (sectionID = 1). However, all segments of lane L2 have no data available, and thus the Join Results put a No Data flag on these segments (highlighted in yellow). Since there is no data available on any segments on Section A Lane 2, the Level 1 No Data rule will not yield any results, and thus we drop through to the Level 2 rule.
The Level 2 No Data rule says "use the Mean Value of any join segments on the same section regardless of Lane". Thus we calculate the Mean Value of the join results using those segments on the same section. In this example, this means we take the average of all values on lane L1, which give a value of 8.02. Thus all missing values on Section A are set to the calculated value of 8.02, as shown in the highlighted cells on the right side of the figure above.
Handling No Data in Join Results – Level 3
When you perform a Data Join and fold the results into an existing FWP, JunoViewer gives you an option to assign values to segments in your FWP for which there is no data available. The logic for filling in such missing data provides for three levels. The first level is the most sophisticated, and looks for Join Result data on the same section and lane, the second level is less sophisticated and looks for Join Results on the same section regardless of lane. The thirds level is the least sophisticated and simply assigns a default value to all segments with the "No Data" flag (indicating that the Data Join could not find any data on that segment).
The image below shows a Level 3 No Data Rule which specifies that, for segments with No Data, a fixed default value of 1.0 should be used:

The figure below shows how this Level 3 No Data Rule will be applied by JunoViewer for a Join Parameter called "Rut_80th" (representing the 80th percentile Rut Depth on each join segment):

In this figure, you can see that none of the segments for Section A (sectionID = 1) have any data for Join Parameter "Rut_80th". Since there is no data available on any lanes of Section A, both the Level 1 and Level 2 No Data Rules will fail to find any results. Because of this, Level 3 will automatically be applied. As shown above, this level simply assigns a fixed default value to all No Data results on this Section.
Calculate Rankings
The Rankings Calculation tool is useful for determining which segments in your FWP has the lowest or highest values on selected Data Parameters. For example, if you calculate the ranking on the Left Wheel-path (LWP) Rut Depth, you can use the ranking to see which of the segments in your FWP has the highest rut - these will be the ones with a ranking percentage close to 100. JunoViewer Web allows you to automatically calculate the rankings on four different data parameters.
To calculate rankings on a specific FWP, go to FWP Management Page and FWP Tools. Select your network and FWP version to work with, then go to the Rankings Calculation panel lower down on the page. It looks like this:

When you click on the Calculate Rankings button, a Long Running Process (LRP) will be initiated for you. Once the result has been calculated, the rankings will be available as "info_" columns in your FWP. You can view these rankings in two ways:
1. By exporting a FWP on which rankings have been calculated. The exported FWP will have columns such as "info_Rut_LWP_90th" to represent the 90th percentile value calculated on the Data Parameter called "Rut_LWP", and "info_Rut_LWP_90th_jvRank" to represent the calculated percentage RANK on this value. Here is an example:

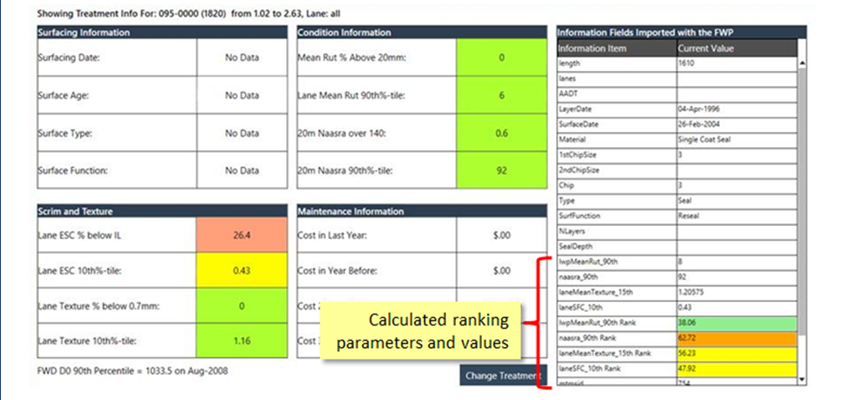
2. Rankings along with colour coding can be seen in Forecast View. Open forecast View, select the cell you wanted to see Info panel. Click on the Info icon  from top menu icons, scroll down to see Rankings. Usually, all Rankings are packed at bottom of the Info Panel grid. from top menu icons, scroll down to see Rankings. Usually, all Rankings are packed at bottom of the Info Panel grid.
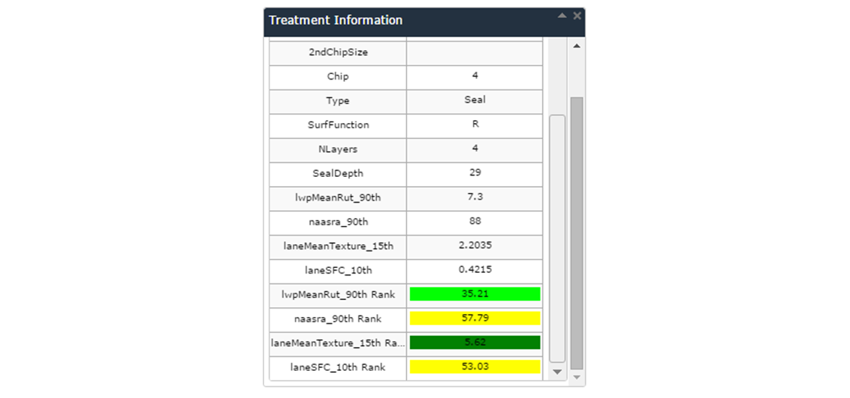
3. By exporting the FWP to the Field Inspection Tool (FIT), you can see the rankings automatically as part of the General Summary panel for the selected segment. It will look something like this:
Join Maintenance Data – not updated
The Join Maintenance Information into FWP feature, located on the FWP Management page under the FWP Tools, allows you to add historical maintenance information from your maintenance table into your Forward Works Program (FWP).
Maintenance data added in this way can be helpful to drive decisions during FWP-related office or field inspections, and can also be used as part of your deterioration model. For example, you may want to adjust the deterioration rate based on the quantity of maintenance required in the last or over previous years. This feature provides you with the functionality in a single click.
Based on your setup (see below) the feature can calculate the following and includes them as information columns in your FWP:
- info_maCostPerKMPerYr: Total maintenance cost per km per year over the selected analysis period
- info_maQtyPerKMPerYr: Total maintenance quantity per km per year over the selected analysis period
- info_maActySumPerKMPerYr: Total number of maintenance actions per km per year over the selected analysis period
- info_maActSum: Total number of maintenance actions over the selected analysis period
- info_maCostPerKMLastYr: Total maintenance cost per km over the last year only
- info_maQtyPerKMLastYr: Total maintenance quantity per km over the last year only
- info_maActySumPerKMLastYr: Total number of maintenance actions per km over the last year only
- info_maActSumLastYr: Total number of maintenance actions over the last year only
- info_maLastYrPercent: The percentage of the total maintenance action count over the analysis period that occurred in the last year alone.
- info_maYearsUsed: The number of years over which maintenance was added (specified in the XML setup, see below)
Note that costs and quantities will be scaled based on the percentage overlap that each maintenance action has with the treatment lengths. This means that if a maintenance action lies fully within a treatment length, then the full cost and quantity is added. However, if a maintenance action is longer than the treatment length or if it only overlaps partly with a treatment length, then the cost and quantity is scaled based on the percentage overlap relative to the full length of the maintenance action.
The feature is located part way down the FWP Management page. (If there are no setups available in the dropdown list, please contact Lonrix Support to add one for you).

You can edit or clone an existing maintenance setup by going to the Edit XML Setup page which you can access under the Manage Menu. Select the Custom class and Maintenance Join type to view the available setups which you can clone, rename and edit as needed.
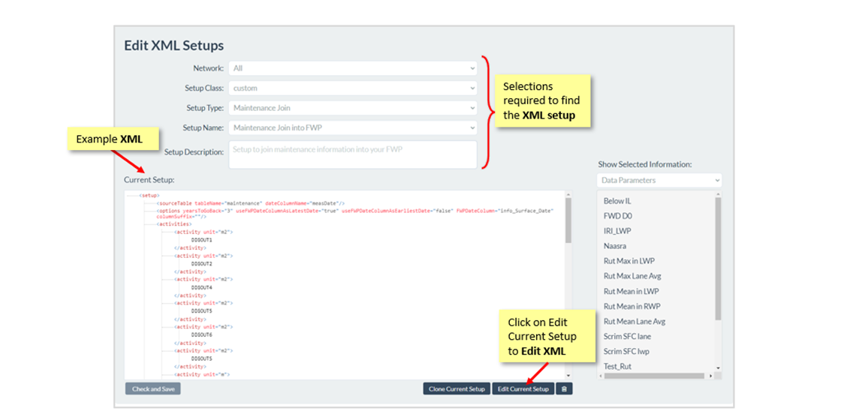
The attributes of the setup are provided in the image and details below:
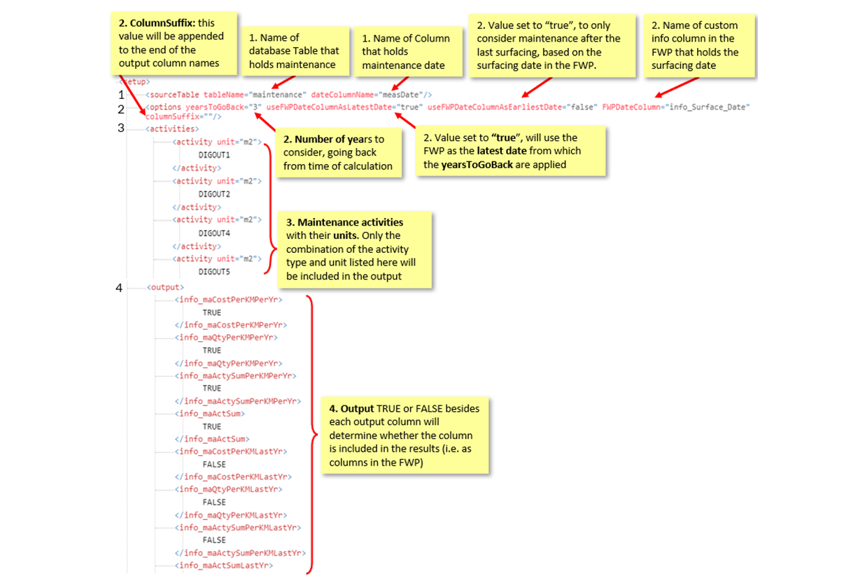
1) SourceTable: Identifies the table that holds maintenance data and the column that holds the maintenance date
2) Options: The following scenarios will help to explain the different options:
- Calculate maintenance results 15 years back from today: <... years to go back = "15" useFWPDateColumnAsLatestDate = "false" useFWPDateColumnAsEarliestDate = "false" FWPDateColumn = ""...>
- Calculate 15 years back OR until the date in info_SurfDate, whichever is less: <... years to go back = "15" useFWPDateColumnAsLatestDate = "false" useFWPDateColumnAsEarliestDate = "true" FWPDateColumn = "info_SurfDate"...
- Calculate 15 years back from the date in info_SurfDate: <... years to go back = "15" useFWPDateColumnAsLatestDate = "true" useFWPDateColumnAsEarliestDate = "false" FWPDateColumn = "info_SurfDate"...>
A columnSuffix can also be added to the output column names (e.g. info_maCostPerKMPerYr) which will enable you to run join setups with looking at different maintenance categories each with their own output columns (e.g. SU = Surfacing, PA = Pavement, DR = Drainage).
3) Activities: a list of the maintenance activities with their units
4) Outputs: the output is where all possible output columns are listed and TRUE or FALSE besides each output column will determine whether the column is included in the results (i.e. as columns in the FWP)
edited by Kiki on 1/16/2024
|
|
|
1/9/2024
Topic:
3. Manage Information Columns
Kiki WagnerAdministrator Posts: 33
|
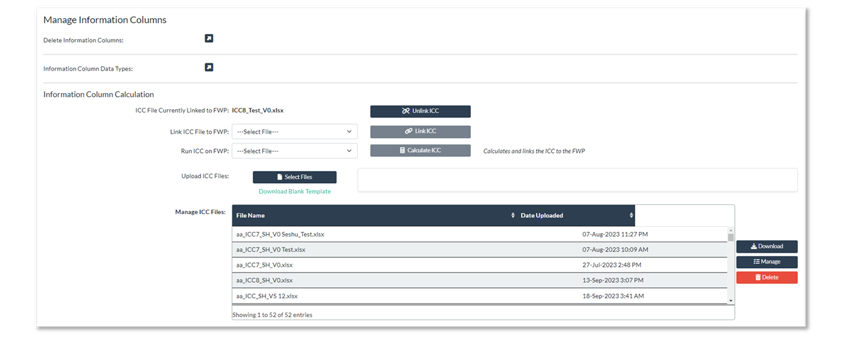
The Manage information Columns has 3 main sections
- Delete information columns
- Information Column Data Types
- Information Column Calculation (ICC)
Delete information columns
If you click on the side arrow, you will be able to select the information columns you wish to delete. If you have records in the FWP that still needs to be reviewed, you will get the following message:
Information Column Data Types
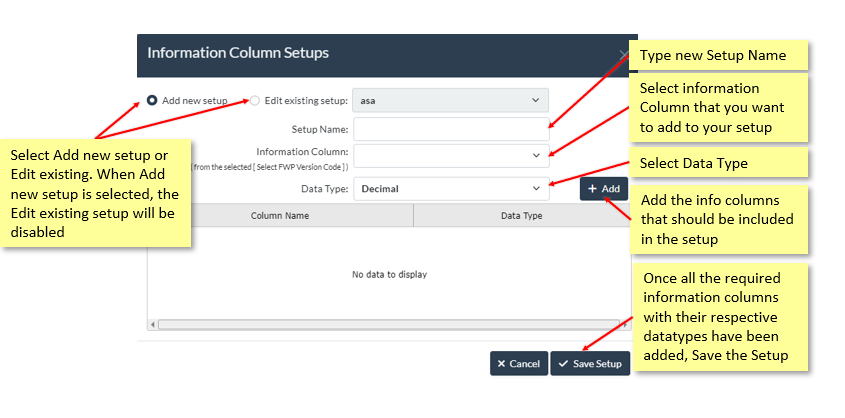
If your account has required information columns that has been setup for an FWP to be Imported into JunoViewer, those Information Column Setups can be managed by clicking on the side arrow next to the Information Column Setups section.
By Setting up required information columns, if a user attempts to import an FWP without these necessary columns, JunoViewer will return an error. This ensures consistency by guaranteeing that each imported FWP contains the required information columns. The functionality now also allows the user to assign a required data type to each column, eliminating downstream process errors that may occur due to inconsistencies in data types.

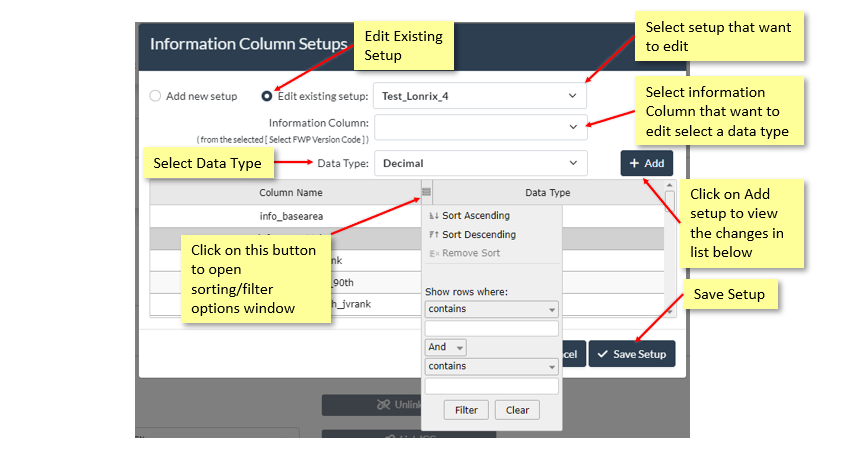
Refer to the help post: Set Required Info Columns for FWP Import for more information on this functionality.
Information Column Calculation
The Information Column Calculation (ICC) feature in JunoViewer enables you to set the information columns in your FWP to re-calculate after the treatment length extents have been updated.
The main ICC functionality is found in the Manage Information Columns section on the FWP Management Page. Here you can download, upload, run and manage your ICC templates. When working online, to re-calculate your information columns, you need to upload your template under Manage Information Columns and click on Calculate ICC.
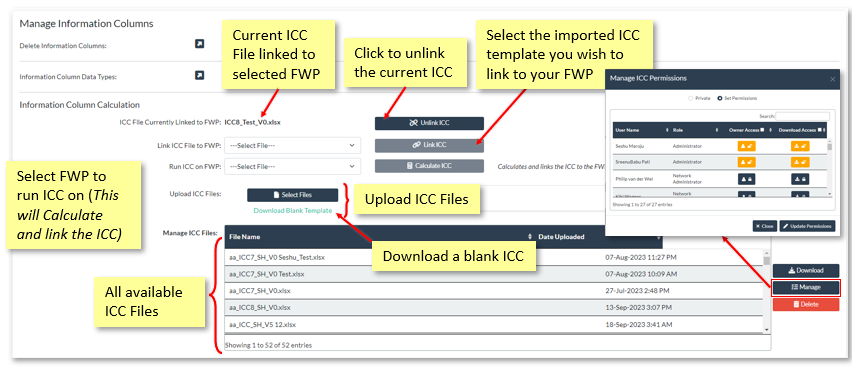
The image below shows an example of the ICC template:
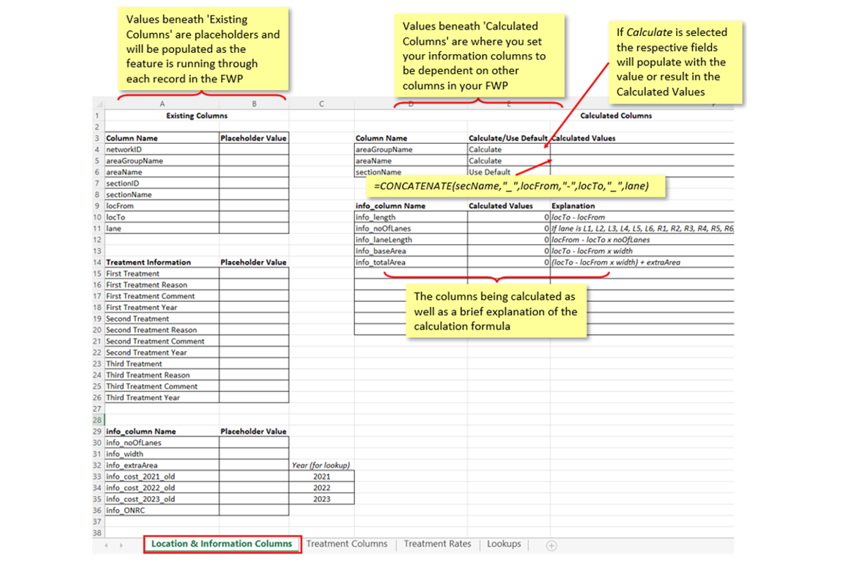
When working offline in the FIT, the ICC linked to your FWP will automatically be linked and downloaded with your FWP.
edited by Kiki on 1/16/2024
|
|
|
1/9/2024
Topic:
2. Manage FWP
Kiki WagnerAdministrator Posts: 33
|
Depending on the account that you are working in, there will be 2 or 3 functionalities under the Manage FWP section:
Cloning a FWP
Under the cloning section you have the ability to clone a selected FWP by using a certain number of sites, all sites or sites within selected area group.

FWP History
When opening the FWP History side arrow, a list of all the actions relating to the current FWP appears. You can sort by users or actions when clicking on the arrows in the heading fields.
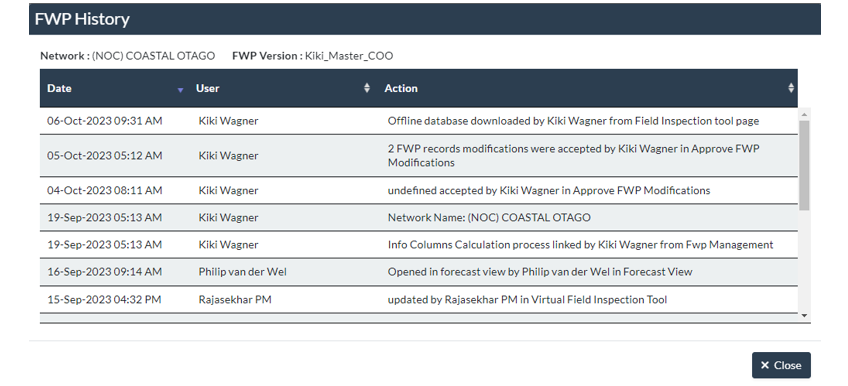
FWP Setup
This functionality is available in the Waka Kotahi account. For more information and the help post - log into Waka Kotahi help documents.
edited by Kiki on 1/15/2024
|
|
|
1/9/2024
Topic:
1. Viewing, Exporting and importing an FWP
Kiki WagnerAdministrator Posts: 33
|
Viewing FWP
Once you have selected your network and FWP, the FWP can be viewed in the FWP Management page as the Top 10 FWP Sites or all FWP sites. You can also select a specific location in the FWP to be displayed. The FWP Information is available when you click on the information icon. Please note that for display purposes, the ‘info_’ prefix has been removed in the grid.
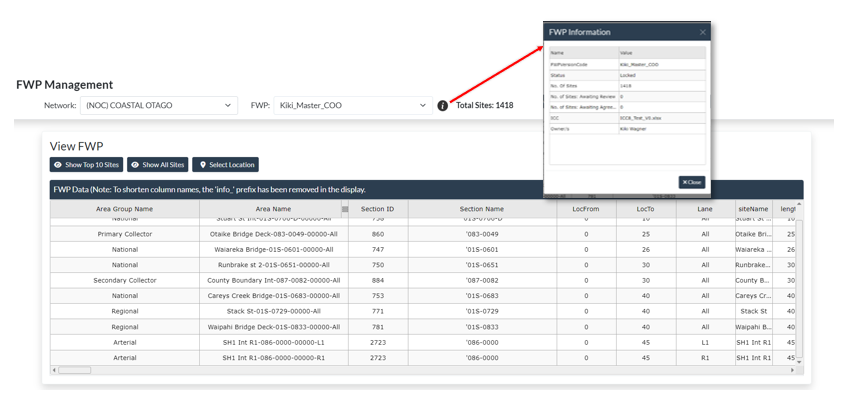
Export FWP
If the ‘All Columns’ radio button is selected, your entire FWP will download. However, if the ‘Select Columns’ radio button is selected, it will enable a list of the Information Columns, Treatment Years and the Treatment Columns as illustrated below, available to select from the FWP to export.
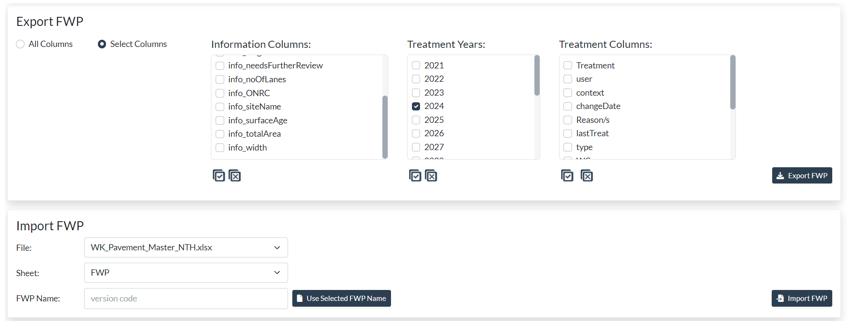
Import FWP
To import a new Forward Works Programme (FWP) into JunoViewer Web, you need to prepare your FWP in an Excel template. Before you attempt to import a FWP, we suggest you read about the versioning of FWPs in JunoViewer Web. Select the File and Sheet to use for the Import.

edited by Kiki on 1/15/2024
|
|
|
1/9/2024
Topic:
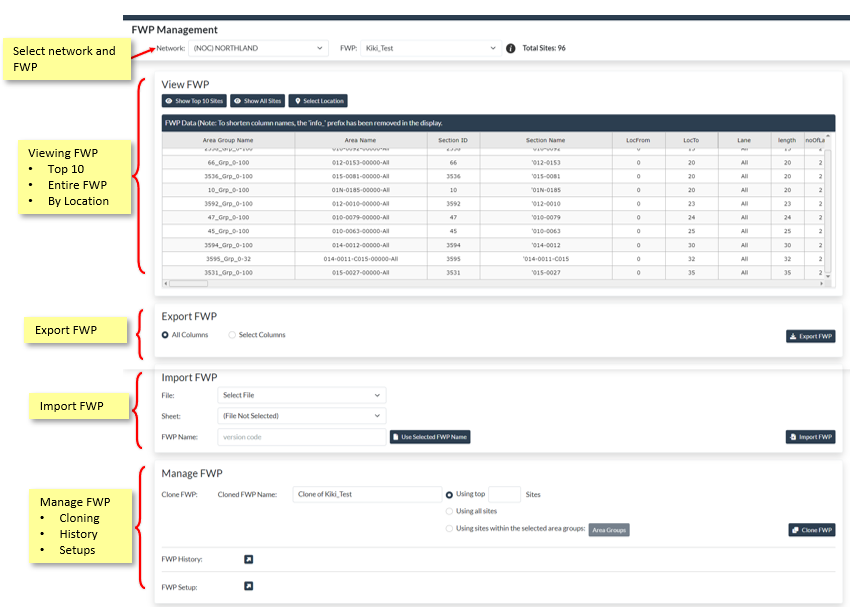
FWP Management Page Help Series
Kiki WagnerAdministrator Posts: 33
|
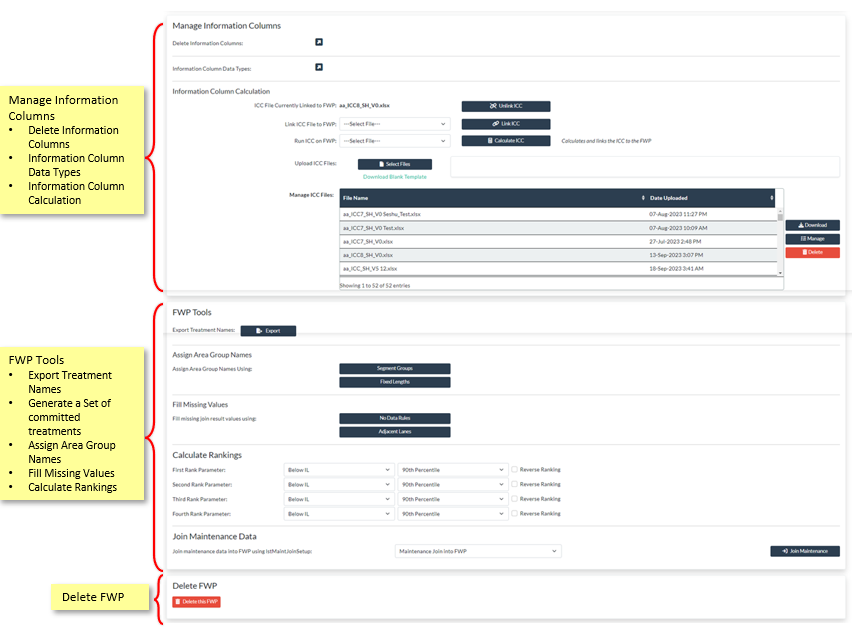
The FWP Management Help series will explain all the functionality that you can access from the FWP – FWP Management page in JunoViewer which contains a few main sections as depicted in the image below.
1. Viewing, exporting and importing an FWP
2. Manage FWP
3. Manage Information Columns
4. FWP Tools
edited by Kiki on 1/15/2024
|
|
|
10/27/2023
Topic:
FWP Change Review
Kiki WagnerAdministrator Posts: 33
|
When changes are made to your FWP, before being updated in the live FWP, the changes are saved to a holding table from where they need to be reviewed. The changes are reviewed from the FWP Change Review page under the FWP menu. Here the owner can see the list of proposed changes and accept or reject them one by one or in bulk.

Once the FWP and Network are selected, the radio button can be selected to see the Review or Agreement sites. A filter can be applied to see the sites based on the Review Status or the Change Type. If a change is selected in the grid view, the details for the selected area will be enabled at the bottom of the grid which will display the location, site information and treatment information.

|
|
|
10/18/2022
Topic:
5. Analyse and FWP Summary
Kiki WagnerAdministrator Posts: 33
|
Analyse and FWP Summary
The pull-outs (activated by clicking the icons on the right-hand side) enable you to further analyse the selected treatment length(s). Select a treatment length and open the pull-outs to view (from top to bottom):
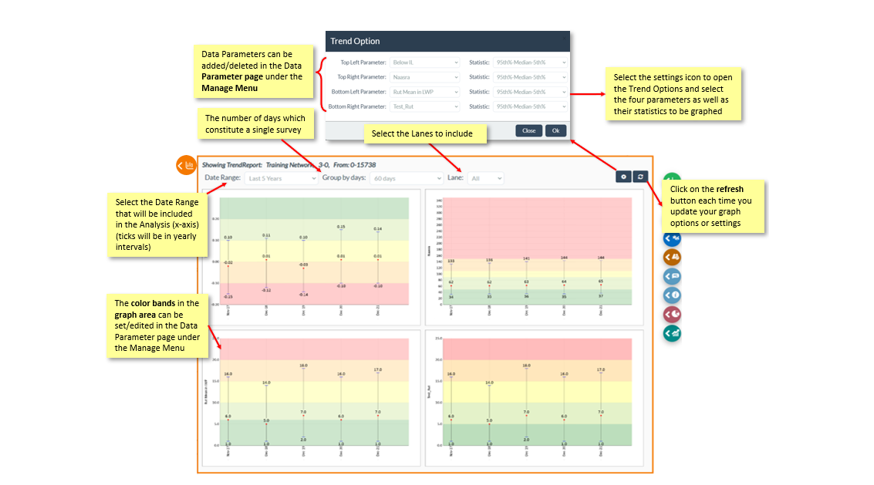
 The Trend Report enables you to view the change in four selected parameters and statistic sets (via the cog icon in the top left of the pull-out), e.g., Naasra, Rut in LWP, Texture in Lane, and Below IL. in data distribution over time for the section selected in the Virtual FIT view The Trend Report enables you to view the change in four selected parameters and statistic sets (via the cog icon in the top left of the pull-out), e.g., Naasra, Rut in LWP, Texture in Lane, and Below IL. in data distribution over time for the section selected in the Virtual FIT view
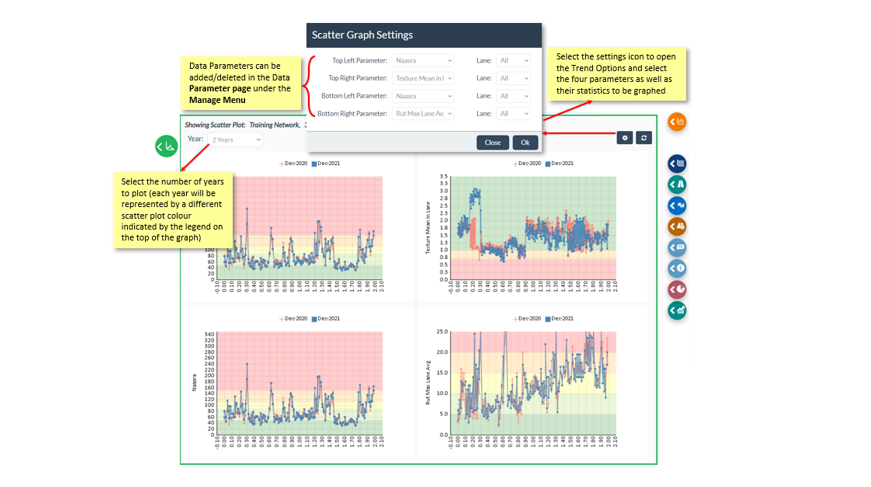
 Scatter Graphs: Similar to Trend pull-out settings, but select four parameters and lanes to view, e.g., Naasra in L1, Naasra in R1, Rut in L1, Rut in R1. Scatter Graphs: Similar to Trend pull-out settings, but select four parameters and lanes to view, e.g., Naasra in L1, Naasra in R1, Rut in L1, Rut in R1.
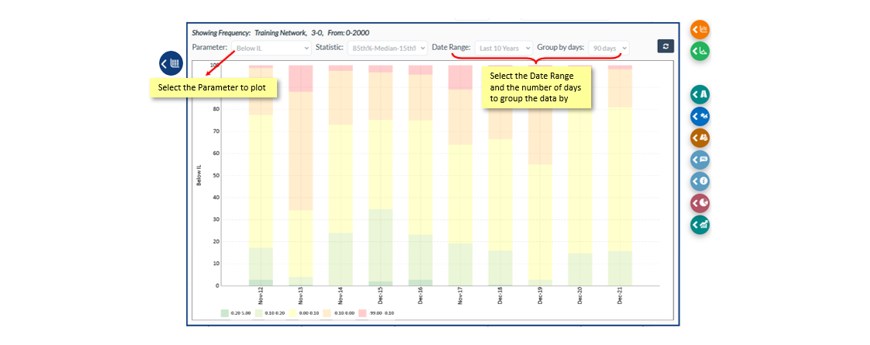
 Frequency graph: Select one parameter to view. The frequency graph plots the nr of occurrences that the parameter has its possible values. The Y-axis represents the frequency count, while the X-axis represents the parameter. Frequency graph: Select one parameter to view. The frequency graph plots the nr of occurrences that the parameter has its possible values. The Y-axis represents the frequency count, while the X-axis represents the parameter.
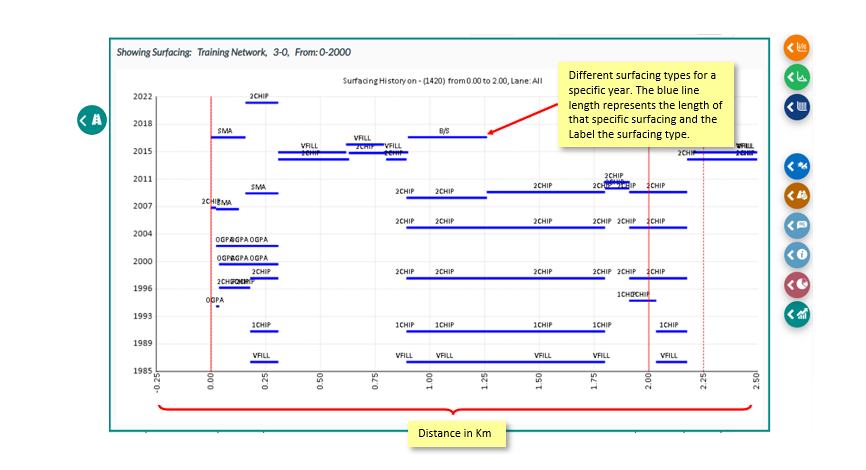
 Surfacing History graph: A history of surfacing for the selected treatment length(s) (between the solid red lines) and 250m either side of the selected (between the dotted red lines). Surfacing History graph: A history of surfacing for the selected treatment length(s) (between the solid red lines) and 250m either side of the selected (between the dotted red lines).
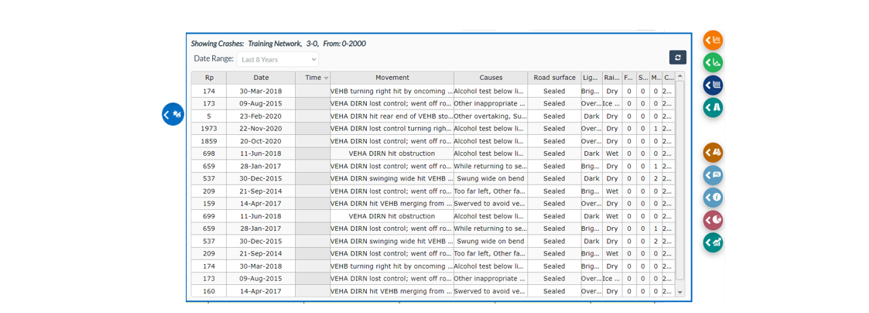
 Crashes: View crashes for 250m either side of the selected treatment length (s) based on the number of years you select. Crashes: View crashes for 250m either side of the selected treatment length (s) based on the number of years you select.
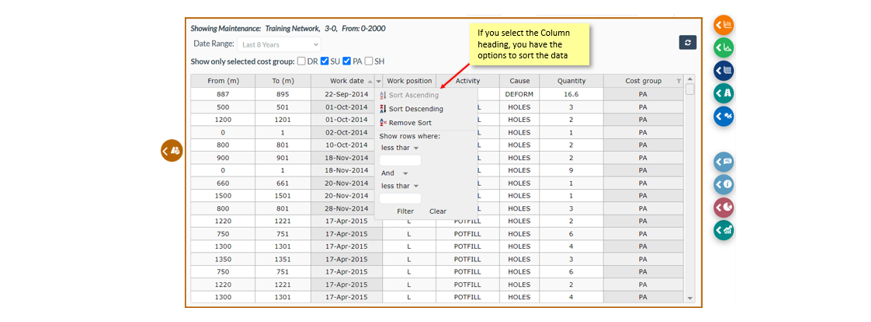
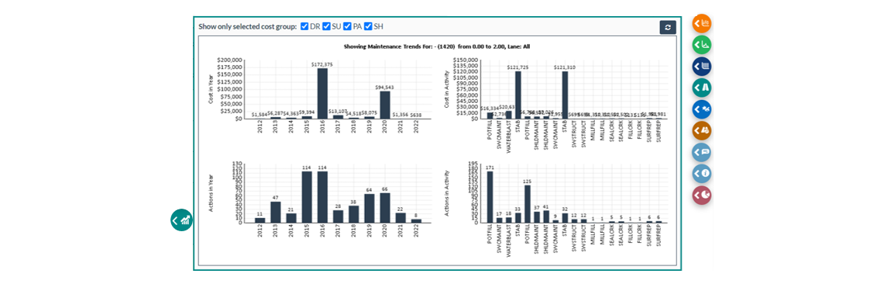
 Maintenance: View maintenance records for the selected treatment length (s) based on the date range and cost groups you select: Drainage (DR), Surfacing (SU), Pavement (PA), and Shoulder (SH). No selected cost groups will show the same as all selected cost groups Maintenance: View maintenance records for the selected treatment length (s) based on the date range and cost groups you select: Drainage (DR), Surfacing (SU), Pavement (PA), and Shoulder (SH). No selected cost groups will show the same as all selected cost groups
 Field Comments: Comments made in the pull-outs are saved to the location on the network, rather than to a specific FWP. Past comments made against the same location can be viewed, e.g. RAPT comments made in previous drive over. Field Comments: Comments made in the pull-outs are saved to the location on the network, rather than to a specific FWP. Past comments made against the same location can be viewed, e.g. RAPT comments made in previous drive over.

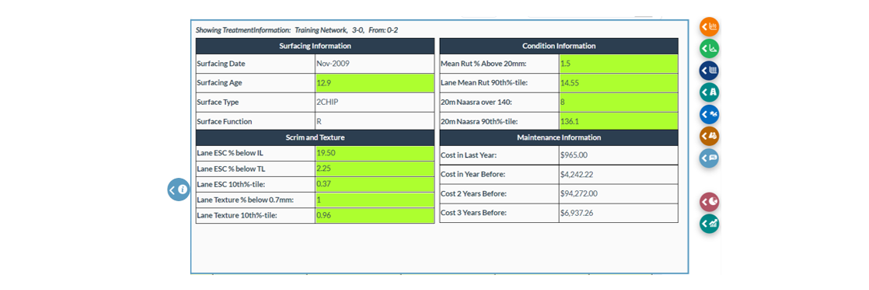
 Information: The Treatment Information pop-up shows a quick summary of asset, condition, and maintenance information for the selected treatment length (s) Information: The Treatment Information pop-up shows a quick summary of asset, condition, and maintenance information for the selected treatment length (s)
 FWP Breakdown: Enables you to summarise your FWP based on the setup that you select for your Row and Column. Select your FWP length and area field as well as a start and end year to view a summary by lane length, Area or Cost (the whole FWP for your network, not just the current treatment length or section) FWP Breakdown: Enables you to summarise your FWP based on the setup that you select for your Row and Column. Select your FWP length and area field as well as a start and end year to view a summary by lane length, Area or Cost (the whole FWP for your network, not just the current treatment length or section)

* Only information columns with fewer than 30 distinct values can be summarised, and the same column cannot be selected for both row and column.
 Maintenance graphs: View 10 years’ maintenance data in several graphs (Cost by Year, Actions by Year, Cost by Activity, Actions by Activity) for the selected cost groups Maintenance graphs: View 10 years’ maintenance data in several graphs (Cost by Year, Actions by Year, Cost by Activity, Actions by Activity) for the selected cost groups
edited by Kiki on 6/15/2023
|
|
|
10/18/2022
Topic:
4. Virtual FIT Video and Map View
Kiki WagnerAdministrator Posts: 33
|
4. Virtual FIT Video and Map View
The Video View in the virtual FIT provides a safe and convenient way to visually assess the condition of the road.
Accessing the Video and Map View
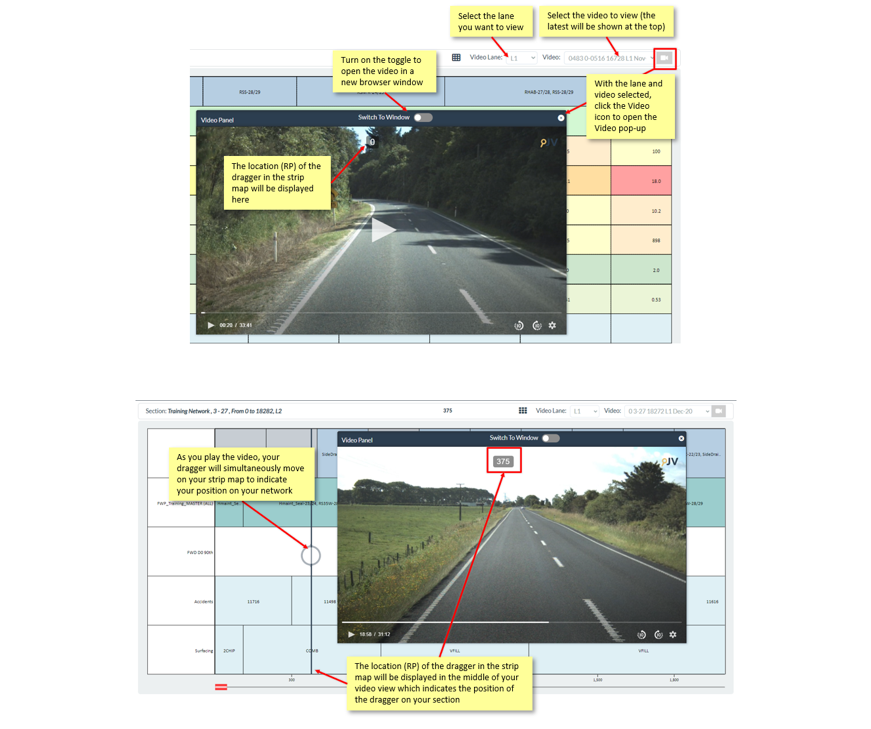
 To view a video, in the right-hand side of the top bar select the lane to view in the Video Lane dropdown and the HSD video to view (the latest will show at the top) in the Video dropdown. Once loaded, click the video icon to open the video pop-up. The video will load to the start location of any treatment length (or other block) you select in the strip map. To view a video, in the right-hand side of the top bar select the lane to view in the Video Lane dropdown and the HSD video to view (the latest will show at the top) in the Video dropdown. Once loaded, click the video icon to open the video pop-up. The video will load to the start location of any treatment length (or other block) you select in the strip map.
Video and Map View Settings
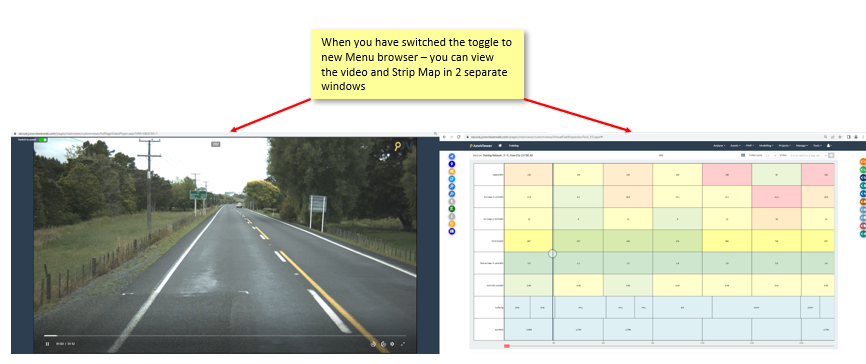
To open the video in a separate window (so you can move it to a separate screen), turn on the ‘Switch to Window’ toggle.
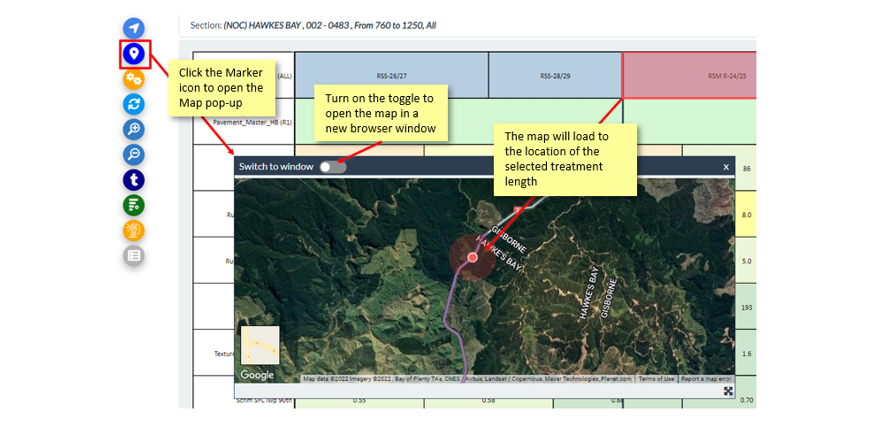
 To open the map, click the location marker icon (left-hand side). The map will load the section and treatment length you have selected. Similar to the video, the map can be viewed as a pop-up or opened in a separate window and moved to another screen. To open the map, click the location marker icon (left-hand side). The map will load the section and treatment length you have selected. Similar to the video, the map can be viewed as a pop-up or opened in a separate window and moved to another screen.
Click here to view the next help post in the series, Virtual FIT Analyse and FWP summary
edited by Kiki on 10/18/2022
edited by Kiki on 10/18/2022
|
|
|
10/18/2022
Topic:
3. FWP setup in Virtual FIT
Kiki WagnerAdministrator Posts: 33
|
FWP setup in Virtual FIT
 Click the cogs icon (left-hand side) to open the Settings pop-up. Ensure the ‘Show FWP’ toggle is switched on and select your Pavement Master FWP and any other FWPs you want to see alongside (e.g., NLTP) in FWP Strip 1, FWP Strip 2, etc. All other settings can be left as default. Click the cogs icon (left-hand side) to open the Settings pop-up. Ensure the ‘Show FWP’ toggle is switched on and select your Pavement Master FWP and any other FWPs you want to see alongside (e.g., NLTP) in FWP Strip 1, FWP Strip 2, etc. All other settings can be left as default.
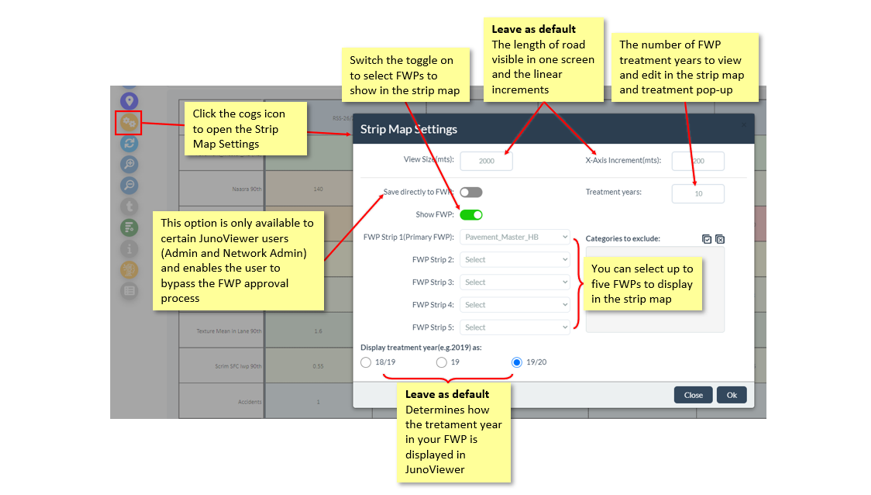
Once loaded, you can select a treatment length by clicking on it. You can select multiple treatment lengths at once if you are interested in analysing the data (e.g., in the pull-outs) for more than one. Note that when multiple treatment lengths are selected the pull-outs will show data from the start of the first selected to the end of the last selected. You can click a treatment length to deselect it, or else the deselect icon besides the Video selection functionality will deselect all selected.

The treatments will be displayed in the treatment lengths in the strip as [Treatment] [Treatment Type Abbreviation] – [Treatment Year], e.g. A racked-in multilayer chipseal planned for the 2024/2025 season will be show as RSM R-24/25.
Click here to view the next help post in the series, Virtual FIT Video and Map View
edited by Kiki on 10/18/2022
|
|
|
10/18/2022
Topic:
2. Setting up your Strip Map View
Kiki WagnerAdministrator Posts: 33
|
Setting up your Strip Map View
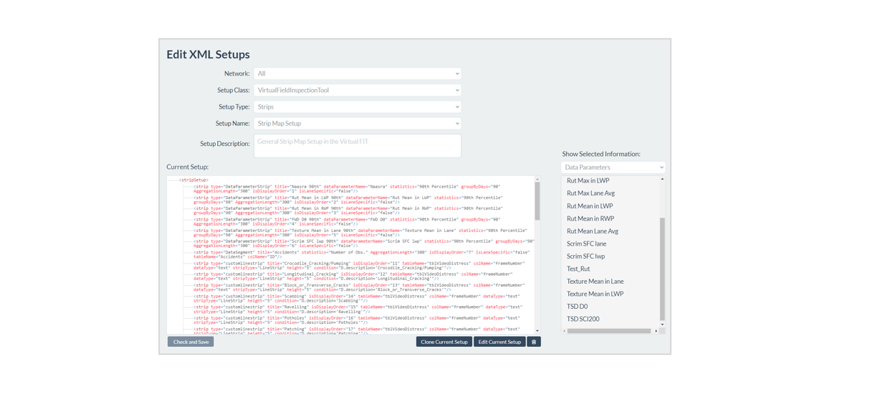
The Strip Map View in the JunoViewer Virtual Field Inspection Tool (Virtual FIT) can be accessed through the Analyse < Virtual Fit Menu path. It is controlled by an XML setup, which is available for editing by an Administrator user in the Edit XML Setup page. The setup can be account-specific (i.e. cover all networks) or cloned and customised for a specific network (or specific networks). Refer to this help post for general instructions on the Edit XML Setup page.
Strip Map View Layout:
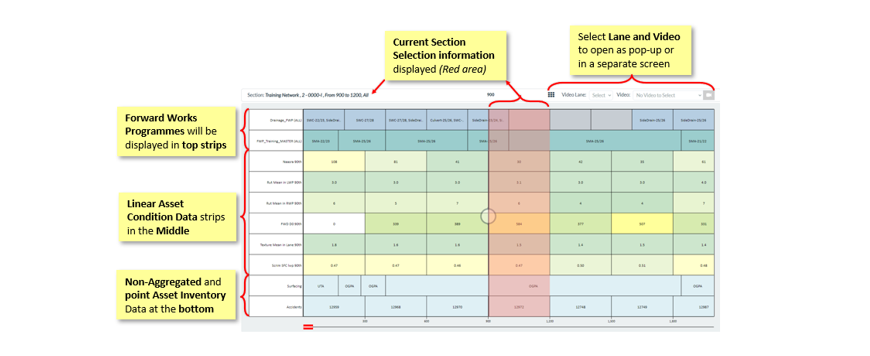
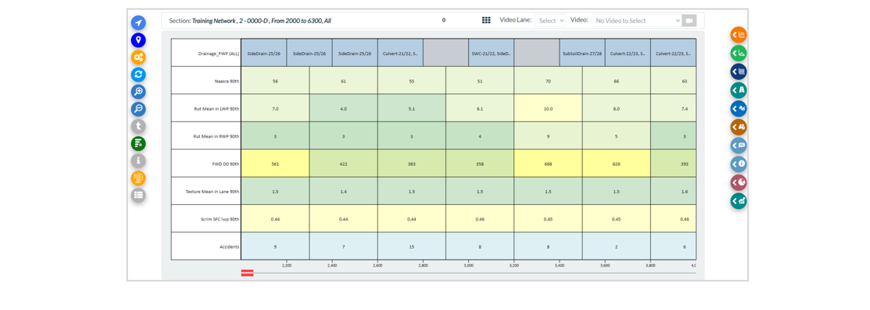
Different Strip Types
There are three strip types available for editing in the Virtual FIT Strip Map setup (the green Icon in the left Menu Bar)
• Data Parameter Strip: Aggregated strips linked directly to a data parameter (e.g. 20m rutting data)
• Data Segment Strip: Aggregated strips linked to a non-data parameter data type (e.g. crashes)
• Non-Aggregated Strip: Non-aggregated strips where the actual start and end locations of the data record are important (e.g. top surface)
Below are instructions relating to each strip type:
Data Parameter Strip
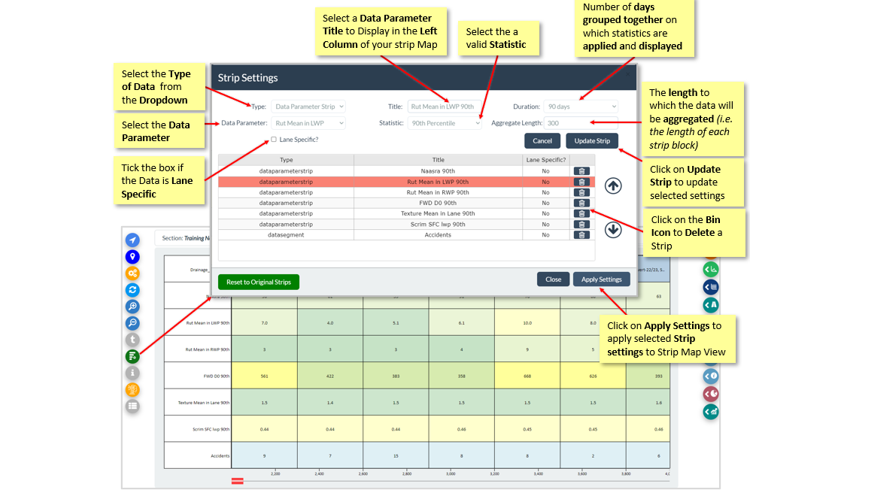
Data Parameter: Name of a data parameter. Rut Mean in LWP
Statistic: A valid statistic. 90th Percentile
Duration: The number of days grouped together on which statistics are applied and displayed
Aggregate Length: The length to which the data will be aggregated (i.e. the length of each strip block). 300
Lane Specific: True (an individual strip will be assigned to each lane containing data) or False (data from across all lanes will be aggregated). Note: this option is applicable when "All" is selected in the Lanes drop-down in the Location pop-up. If a single lane is selected, only the data for the selected lane will be displayed.)
Data Segment Strip
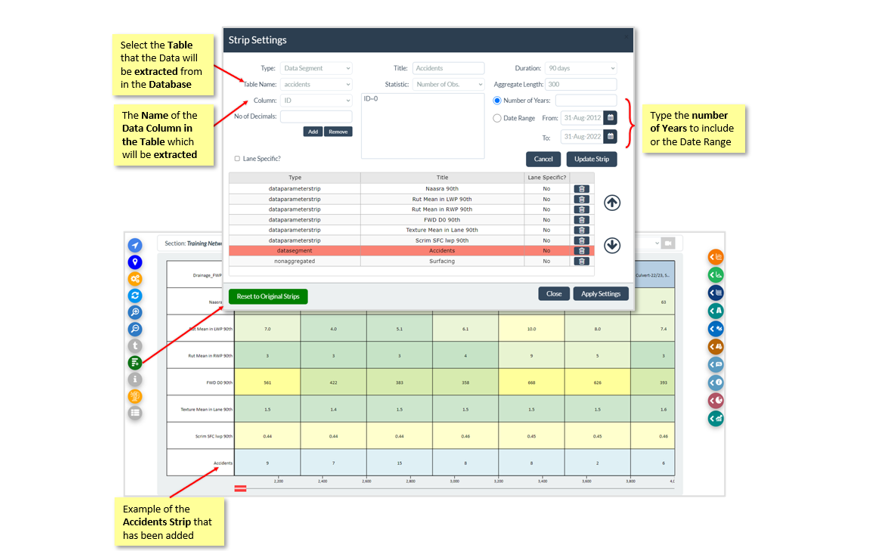
Statistics: A valid statistic. Number of Obs.
Aggregate Length: The length to which the data will be aggregated (i.e. the length of each strip block). 300
Lane Specific: See above instructions. True or False
Title: Name of the strip. Crashes
Table Name: Name of the table in JunoViewer where the data is stored. Crash
Column Name: Name of the column in the above table. ID
Non-Aggregated Strip
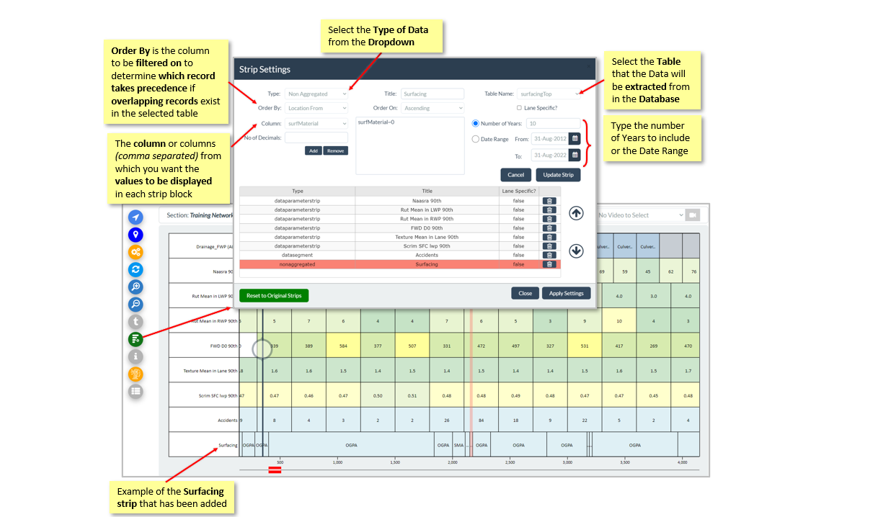
Lane Specific: See above instructions. True or False
Title: Name of the strip. Surface Type
Data Table: Name of the table in JunoViewer where the data is stored. surfacingTop
Columns: The column or columns (comma separated) from which you want the values to be displayed in each strip block. surfMaterial
Order By: The column to be filtered on to determine which record takes precedence if overlapping records exist in the selected table. locFrom
Order On: The order to be applied to the OrderBy column. Ascending or Descending
Decimals: Number of decimals to be displayed (if only one column, a number column, is selected to be displayed). 0
Edit XML Setups Page
Click here to view the next help post in the series, FWP Setup in Virtual FIT
edited by Kiki on 10/18/2022
|
|
|
10/18/2022
Topic:
1. Getting started in the Virtual FIT
Kiki WagnerAdministrator Posts: 33
|
Getting started in the Virtual FIT
Accessing the Virtual FIT
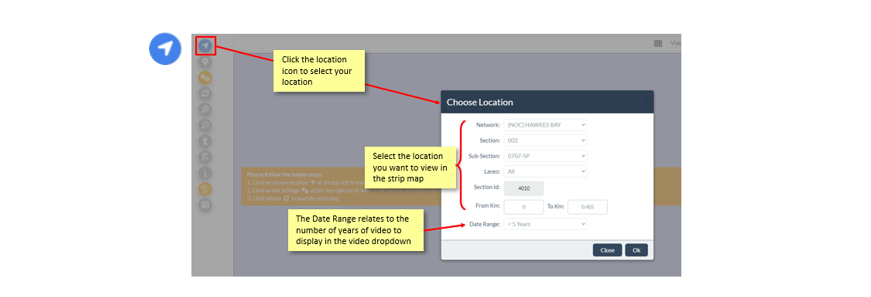
You can access the Virtual FIT under the Analyse menu. Once you have opened the Virtual FIT, the first step is to choose the location by clicking on the location icon.
Virtual FIT Layout
Once you have chosen your location, your strip map will appear. The strip map portion of the Virtual FIT is based on the FWP Validation Module in the offline JunoViewer Field Inspection Tool (FIT) and is equipped with the similar functionality:
- Validate assigned treatments using asset, event, and condition data
- Add, edit, and delete programmed treatments
- Add and edit treatment lengths
Below is an example of a Strip Map layout which will be vary depending on your current Strip Map settings discussed further in this Help Series.
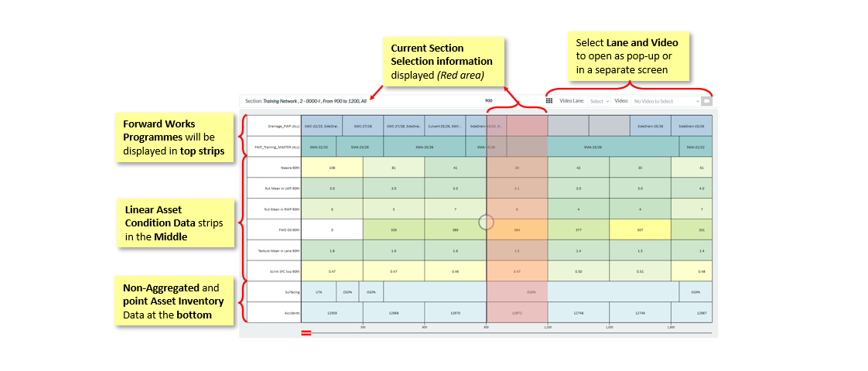
The image below is an example of the Strip Map with all the icon settings left and Pull-outs on your right which will be explained in more detail in this Help post series:
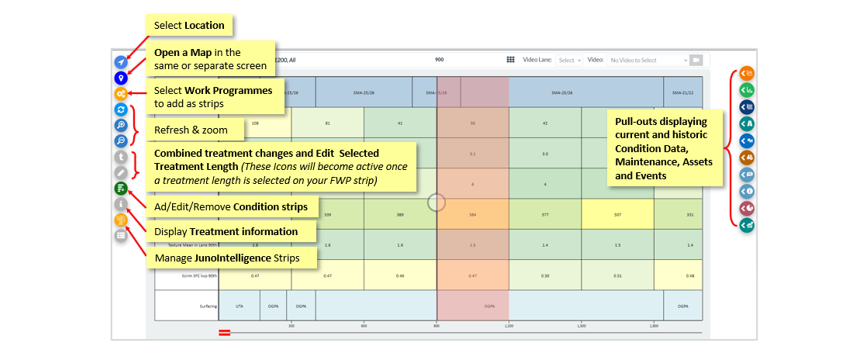
Click here to view the next help post in the series, Setting up your Strip Map View
edited by Kiki on 10/18/2022
|
|
|
9/29/2022
Topic:
Key Definitions in JunoViewer Web
thomas.potgieter@lonrix.comAdministrator Posts: 29
|
The following paragraphs provide key definitions which need to be understood by users of the system.
While some of these definitions may seem obvious, it is important to understand their meaning in the context of the software application, and therefore detailed explanations of all key concepts are provided.
The figure below illustrates some of the concepts explained in the paragraphs that follow:

Network - A network is defined as a logical group of network sections. Any logical group of sections can be defined as a network. For example, a network can consist of all roads within a suburb, a province, or a specific freeway. In JunoViewer Web, networks cannot share the same Forward Works Programme (FWP) and therefore networks typically have different treatment options, budgets, etc.
Section - As shown in the figure above, a section is defined as part of a network with a specific ID and a unique set of linear locations in each lane. In road networks, sections typically contain several lanes. All data measured and stored on that section needs to be referenced by the section ID. The ID of each section should be unique across all networks. Thus, you cannot have a section with ID = 13 in network 1 and in network 2.
JunoViewer Web does not automatically assign IDs to network sections. When you import your network section definitions, you need to provide an ID for each section, and this ID must be unique over all sections, regardless of which network the sections belong to. The ability to use user-defined IDs for road sections makes it easy to incorporate section definitions and data that was previously held in another Asset Management System or database. Click here to see how you can/should manage Section Definitions in JunoViewer Web.
Segment - A segment is defined as part of a section – typically defined for analysis or modelling purposes. As shown in the figure above, a segment could be the leftmost lane of a specific section, thereby forming part of a section. In some cases, a segment will cover the entire section.
Treatment Length - Within JunoViewer Web, a treatment length and a segment are the same, as defined above and in the figure above. The main difference between a segment and a treatment length lies in the use context. When a segment is discussed or analysed in the context of a FWP or in terms of a treatment planned for that segment, we will often refer to the segment as a Treatment Length. Thus segments which are defined within a FWP with assigned treatments, will be referred to as treatment lengths.
Modelling Segment - A modelling segment and a segment are the same, as defined above and in the figure above. As with a treatment length, the main difference between a segment and a modelling segment lies in the use context. When a segment is discussed or analysed in the context of a deterioration or forecast model, then the segment is generally referred to as a modelling segment.
Segment Group - As shown in the figure above, a segment group is defined as a grouping of segments to form a reporting or analysis unit on the network. For example, you can define a Segment Group which comprises all segments that received a rehabilitation in year 2013, and then label that group of segments as “Treated Segments 2013”. In network view, you can then conveniently obtain statistics or reports using data that fall within those segments.
Lane Segments - A “lane segment” is defined as a segment of a road that is specific to a single lane. In Figure 1 above, segments 1 and 3 are lane segments, while segment 2 is not a lane segment. Lane segments are optional information about a network, and are often used for:
- Modelling purposes, where treatments may vary depending on the lane codes.
- Plotting purposes, e.g. to show where a lane starts and ends.
You can define your lanes in any order in JunoViewer. One often used, but not mandatory, for the definition of lanes, is as shown below. Other configurations, for example having lanes "L1" and "R1" closest to the median, can also be used, or you can “simple code” your lanes with names like "slow", "middle1", "middle2", "fast" etc.

The key element to note from this figure is that lanes L1 and R1 are the slow lanes carrying heavy traffic. Note that the direction of traffic as shown in this figure can be reversed and this will not affect the features in JunoViewer Web. For example, in this figure, lanes L1 and L2 are lanes where the traffic is in the increasing reference direction, whereas R1 and R2 are in a decreasing reference direction. If this convention is reversed, as in countries where traffic drive on the right side of the road, then this will still be handled elegantly in JunoViewer Web.
Edited by Thomas on 9/29/2022
edited by Rashel on 9/29/2022
|
|
|