|
Kiki Wagner Administrator Posts: 33
10/18/2022
|
Kiki WagnerAdministrator Posts: 33
Analyse and FWP Summary
The pull-outs (activated by clicking the icons on the right-hand side) enable you to further analyse the selected treatment length(s). Select a treatment length and open the pull-outs to view (from top to bottom):
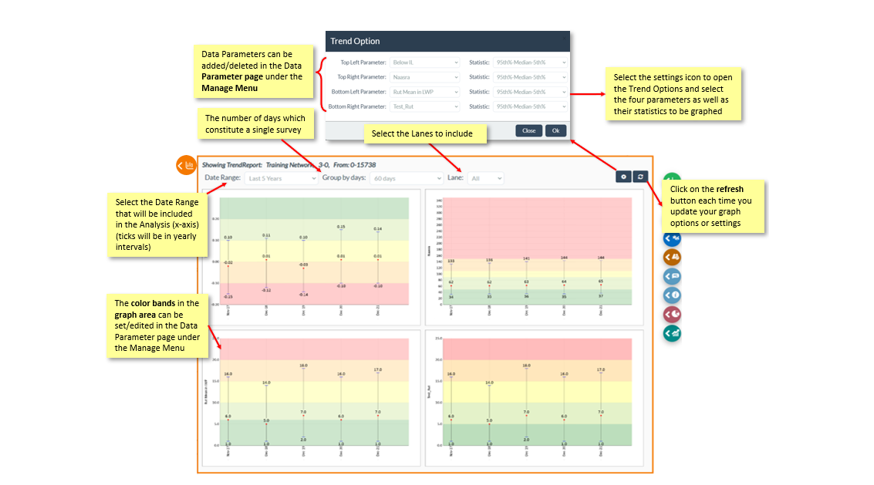
 The Trend Report enables you to view the change in four selected parameters and statistic sets (via the cog icon in the top left of the pull-out), e.g., Naasra, Rut in LWP, Texture in Lane, and Below IL. in data distribution over time for the section selected in the Virtual FIT view The Trend Report enables you to view the change in four selected parameters and statistic sets (via the cog icon in the top left of the pull-out), e.g., Naasra, Rut in LWP, Texture in Lane, and Below IL. in data distribution over time for the section selected in the Virtual FIT view
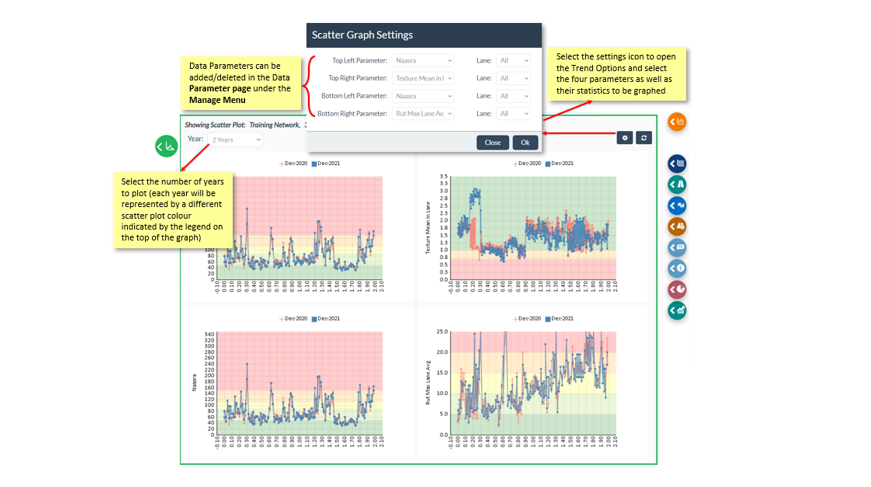
 Scatter Graphs: Similar to Trend pull-out settings, but select four parameters and lanes to view, e.g., Naasra in L1, Naasra in R1, Rut in L1, Rut in R1. Scatter Graphs: Similar to Trend pull-out settings, but select four parameters and lanes to view, e.g., Naasra in L1, Naasra in R1, Rut in L1, Rut in R1.
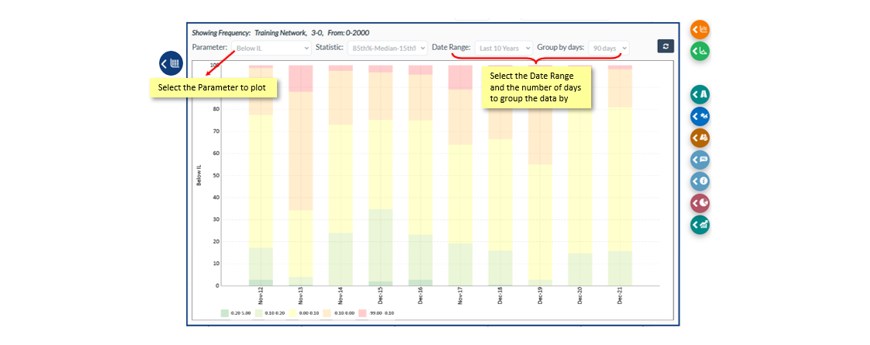
 Frequency graph: Select one parameter to view. The frequency graph plots the nr of occurrences that the parameter has its possible values. The Y-axis represents the frequency count, while the X-axis represents the parameter. Frequency graph: Select one parameter to view. The frequency graph plots the nr of occurrences that the parameter has its possible values. The Y-axis represents the frequency count, while the X-axis represents the parameter.
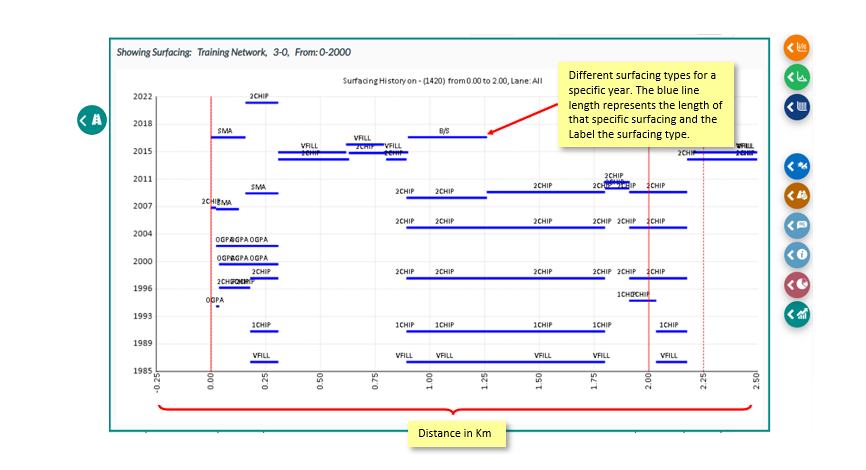
 Surfacing History graph: A history of surfacing for the selected treatment length(s) (between the solid red lines) and 250m either side of the selected (between the dotted red lines). Surfacing History graph: A history of surfacing for the selected treatment length(s) (between the solid red lines) and 250m either side of the selected (between the dotted red lines).
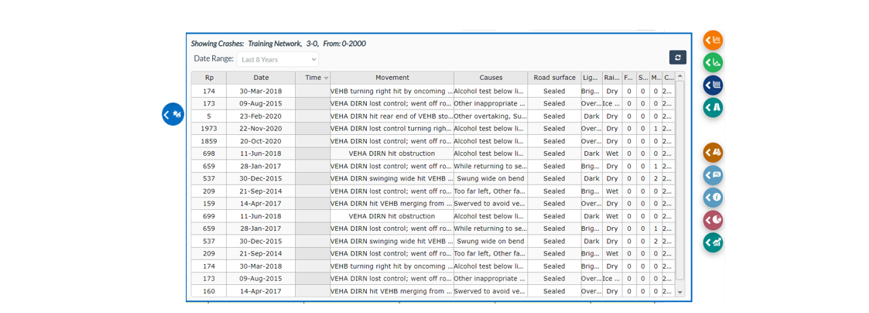
 Crashes: View crashes for 250m either side of the selected treatment length (s) based on the number of years you select. Crashes: View crashes for 250m either side of the selected treatment length (s) based on the number of years you select.
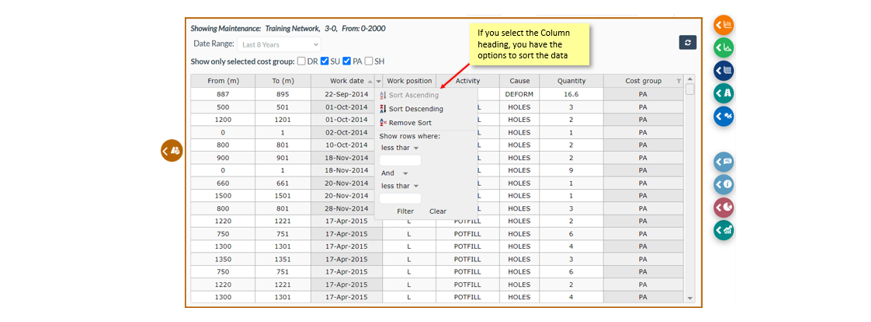
 Maintenance: View maintenance records for the selected treatment length (s) based on the date range and cost groups you select: Drainage (DR), Surfacing (SU), Pavement (PA), and Shoulder (SH). No selected cost groups will show the same as all selected cost groups Maintenance: View maintenance records for the selected treatment length (s) based on the date range and cost groups you select: Drainage (DR), Surfacing (SU), Pavement (PA), and Shoulder (SH). No selected cost groups will show the same as all selected cost groups
 Field Comments: Comments made in the pull-outs are saved to the location on the network, rather than to a specific FWP. Past comments made against the same location can be viewed, e.g. RAPT comments made in previous drive over. Field Comments: Comments made in the pull-outs are saved to the location on the network, rather than to a specific FWP. Past comments made against the same location can be viewed, e.g. RAPT comments made in previous drive over.

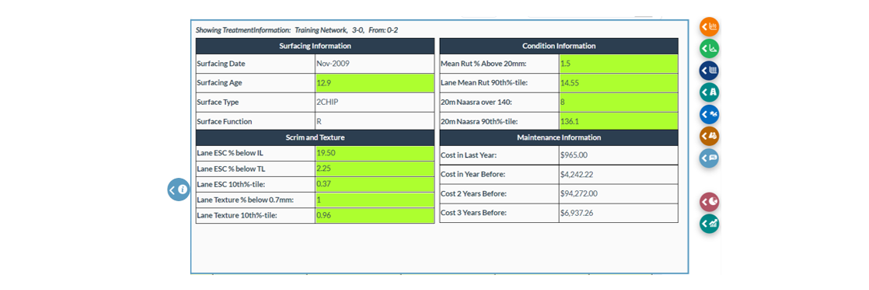
 Information: The Treatment Information pop-up shows a quick summary of asset, condition, and maintenance information for the selected treatment length (s) Information: The Treatment Information pop-up shows a quick summary of asset, condition, and maintenance information for the selected treatment length (s)
 FWP Breakdown: Enables you to summarise your FWP based on the setup that you select for your Row and Column. Select your FWP length and area field as well as a start and end year to view a summary by lane length, Area or Cost (the whole FWP for your network, not just the current treatment length or section) FWP Breakdown: Enables you to summarise your FWP based on the setup that you select for your Row and Column. Select your FWP length and area field as well as a start and end year to view a summary by lane length, Area or Cost (the whole FWP for your network, not just the current treatment length or section)

* Only information columns with fewer than 30 distinct values can be summarised, and the same column cannot be selected for both row and column.
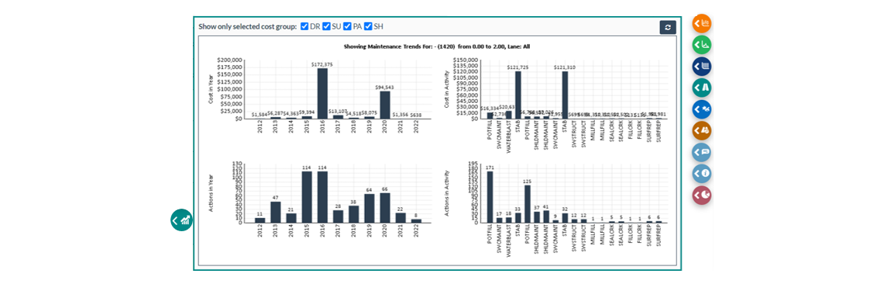
 Maintenance graphs: View 10 years’ maintenance data in several graphs (Cost by Year, Actions by Year, Cost by Activity, Actions by Activity) for the selected cost groups Maintenance graphs: View 10 years’ maintenance data in several graphs (Cost by Year, Actions by Year, Cost by Activity, Actions by Activity) for the selected cost groups
edited by Kiki on 6/15/2023
|