|
Kiki Wagner Administrator Posts: 33
1/9/2024
|
Kiki WagnerAdministrator Posts: 33
The FWP tools section has 5 subsections:
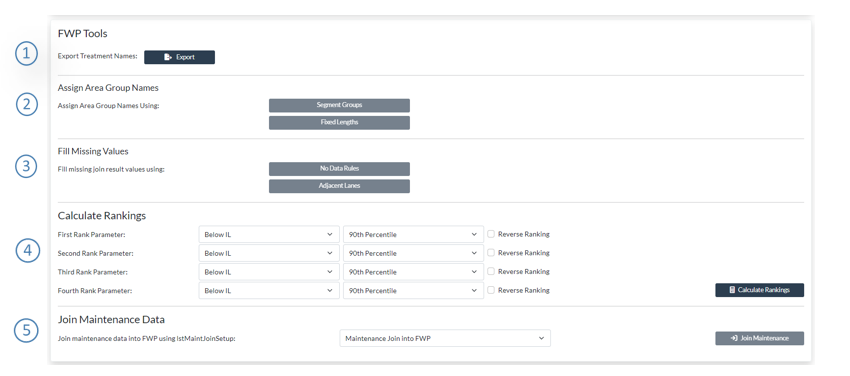
Export treatment names
The Export Treatment Names functionality under the FWP tools section in the FWP Management page enables you to derive the treatment names from your FWP. The output will be an excel file with the distinct treatment names contained in your FWP
Assign area Group Names
You can assign an area group name by Segment Group Category or by using fixed lengths. If you click on the Segment groups option.
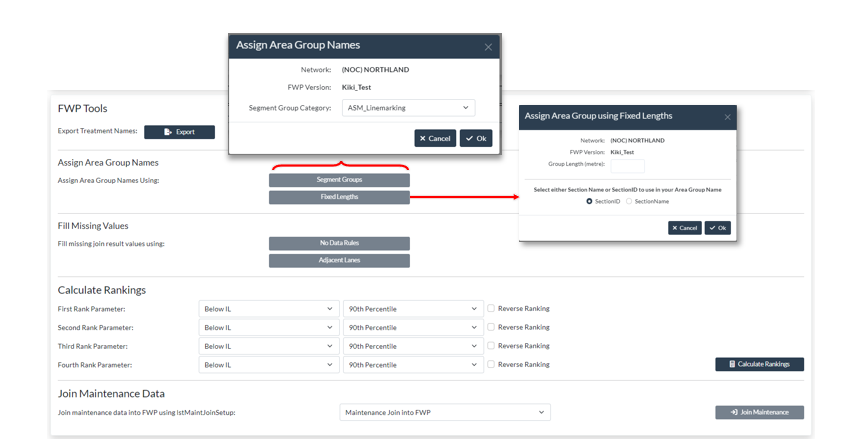
Fill missing Values
One of the key challenges in deterioration modelling is the handling of missing data on join segments, or - in the case of FWP pre-processing, modelling segments. This is often a problem on networks where condition is not often performed in certain lanes (e.g. fast lanes on free ways), and yet the model needs to take these segments into account. Because of the realities of network level data collection, the result of the automated data join (previous section), may often look like that shown in the figure below:

If this set of data is used as a basis for the deterioration model, errors may result if proper default values are not assigned. Although JunoViewer Web’s deterioration model allows you to assign default values as part of the model initialization process, the model set pre-processing algorithm contains a more flexible and powerful approach to handling missing data values.
In this approach, missing values on a segment are handled in three stages, or levels, as shown by the figure below. It should be noted that this process is applied on each Join Parameter data type, which is normally represented by a specific source table and column:
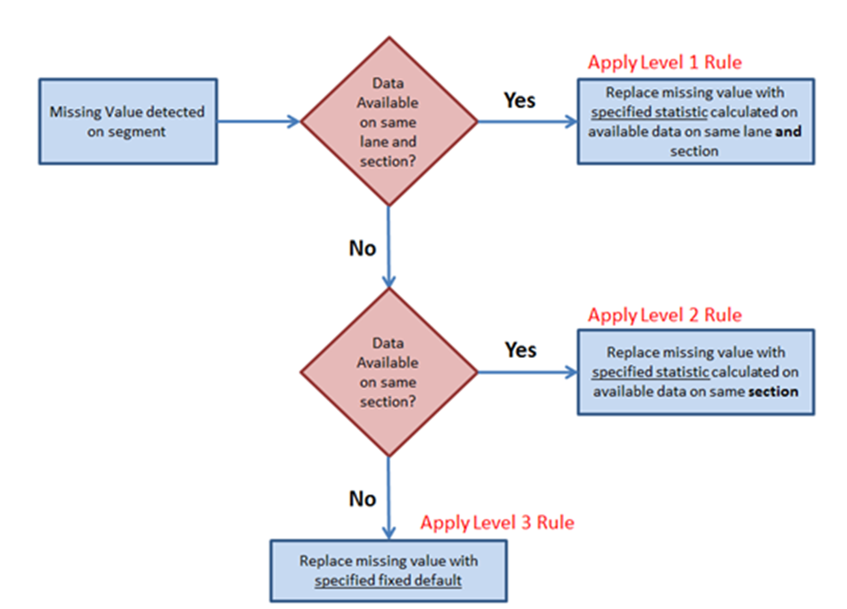
As can be seen from the figure above, the completion of missing values proceeds in three steps. First, the model checks whether there is any data available for the current segment’s lane and section. If so, then this data is used to calculate a specified statistic (e.g. 80th percentile), and this value is then used as a surrogate to replace the missing value.
If no data is found for the specified lane and section, the process falls down a level and checks if there is any data available on the same section, without taking lanes into consideration. If some data is found, then this data is used to calculate a specified percentile which is then used as a surrogate to replace the missing value. If no data is found for the current data type on the entire section, then the algorithm has no choice but to apply a specified fixed default value.
To specify the statistics to use for each of these three levels, you need to click on the No Data Rules button when editing Join Parameter properties (see the Join Parameter page under the settings menu).
When you perform a Data Join and fold the results into an existing FWP, JunoViewer gives you an option to assign values to segments in your FWP for which there is no data available. The logic for filling in such missing data provides for three levels. The first level is the most sophisticated and looks for Join Result data on the same section and lane. Using such data (if any is found) a specified statistic is then calculated using the available join data on the same section and lane, and this statistic value is assigned to all segments with the "No Data" flag (indicating that the Data Join could not find any data on that segment).
Handling No Data in Join Results – Level 1
The image below shows a Level 1 No Data Rule which specifies that, for segments with No Data, the Mean Value on available join results on the same section and lane should be used:

The figure below shows how this Level 1 No Data Rule will be applied by JunoViewer for a Join Parameter called "Rut_80th" (representing the 80th percentile Rut Depth on each join segment):

In this figure, you can see that lane L1 has data on all segments for Section A (sectionID = 1). However, some segments of lane L2 have no data available, and thus the Join Results put a No Data flag on these segments (highlighted in yellow). Since the Level 1 No Data rule says "use the Mean Value of any join segments on the same section and lane", we calculate the Mean Value of the join results using only those segments on the same section and lane. In this example, this means we take the average of 7.2 and 4.3 (available values on lane L2 on Section A, shown in red). The average is 5.75, and is filled into the cells on this section where the No Data flag is found.
If none of the segments on Section A Lane 2 have valid data, then the No Data algorithm will automatically fall through to the Level 2 No Data rule.
Handling No Data in Join Results – Level 2:
When you perform a Data Join and fold the results into an existing FWP, JunoViewer gives you an option to assign values to segments in your FWP for which there is no data available. The logic for filling in such missing data provides for three levels. The first level is the most sophisticated, and looks for Join Result data on the same section and lane. The second level uses only those Join Results found on the same Section, regardless of lane. The Level 2 No Data rule is automatically applied for any segment where the Level 1 rule did not yield any result (i.e. still no data found).
The image below shows a Level 2 No Data Rule which specifies that, for segments with No Data, the Mean Value on available join results on the same section should be used:

The figure below shows how this Level 1 No Data Rule will be applied by JunoViewer for a Join Parameter called "Rut_80th" (representing the 80th percentile Rut Depth on each join segment):

In this figure, you can see that lane L1 has data on all segments for Section A (sectionID = 1). However, all segments of lane L2 have no data available, and thus the Join Results put a No Data flag on these segments (highlighted in yellow). Since there is no data available on any segments on Section A Lane 2, the Level 1 No Data rule will not yield any results, and thus we drop through to the Level 2 rule.
The Level 2 No Data rule says "use the Mean Value of any join segments on the same section regardless of Lane". Thus we calculate the Mean Value of the join results using those segments on the same section. In this example, this means we take the average of all values on lane L1, which give a value of 8.02. Thus all missing values on Section A are set to the calculated value of 8.02, as shown in the highlighted cells on the right side of the figure above.
Handling No Data in Join Results – Level 3
When you perform a Data Join and fold the results into an existing FWP, JunoViewer gives you an option to assign values to segments in your FWP for which there is no data available. The logic for filling in such missing data provides for three levels. The first level is the most sophisticated, and looks for Join Result data on the same section and lane, the second level is less sophisticated and looks for Join Results on the same section regardless of lane. The thirds level is the least sophisticated and simply assigns a default value to all segments with the "No Data" flag (indicating that the Data Join could not find any data on that segment).
The image below shows a Level 3 No Data Rule which specifies that, for segments with No Data, a fixed default value of 1.0 should be used:

The figure below shows how this Level 3 No Data Rule will be applied by JunoViewer for a Join Parameter called "Rut_80th" (representing the 80th percentile Rut Depth on each join segment):

In this figure, you can see that none of the segments for Section A (sectionID = 1) have any data for Join Parameter "Rut_80th". Since there is no data available on any lanes of Section A, both the Level 1 and Level 2 No Data Rules will fail to find any results. Because of this, Level 3 will automatically be applied. As shown above, this level simply assigns a fixed default value to all No Data results on this Section.
Calculate Rankings
The Rankings Calculation tool is useful for determining which segments in your FWP has the lowest or highest values on selected Data Parameters. For example, if you calculate the ranking on the Left Wheel-path (LWP) Rut Depth, you can use the ranking to see which of the segments in your FWP has the highest rut - these will be the ones with a ranking percentage close to 100. JunoViewer Web allows you to automatically calculate the rankings on four different data parameters.
To calculate rankings on a specific FWP, go to FWP Management Page and FWP Tools. Select your network and FWP version to work with, then go to the Rankings Calculation panel lower down on the page. It looks like this:

When you click on the Calculate Rankings button, a Long Running Process (LRP) will be initiated for you. Once the result has been calculated, the rankings will be available as "info_" columns in your FWP. You can view these rankings in two ways:
1. By exporting a FWP on which rankings have been calculated. The exported FWP will have columns such as "info_Rut_LWP_90th" to represent the 90th percentile value calculated on the Data Parameter called "Rut_LWP", and "info_Rut_LWP_90th_jvRank" to represent the calculated percentage RANK on this value. Here is an example:

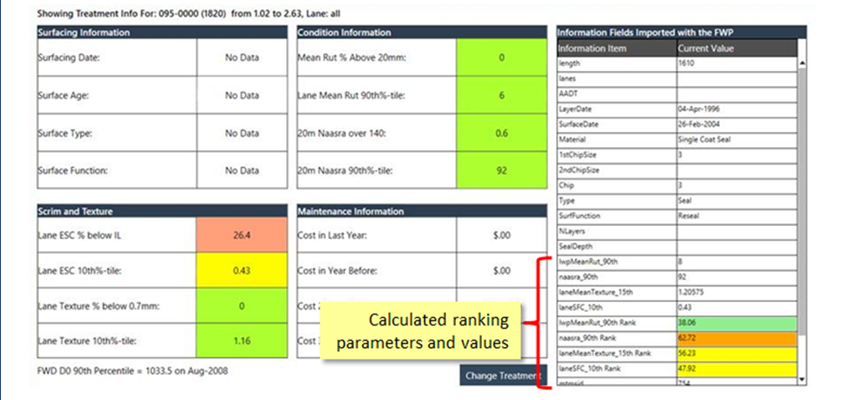
2. Rankings along with colour coding can be seen in Forecast View. Open forecast View, select the cell you wanted to see Info panel. Click on the Info icon  from top menu icons, scroll down to see Rankings. Usually, all Rankings are packed at bottom of the Info Panel grid. from top menu icons, scroll down to see Rankings. Usually, all Rankings are packed at bottom of the Info Panel grid.
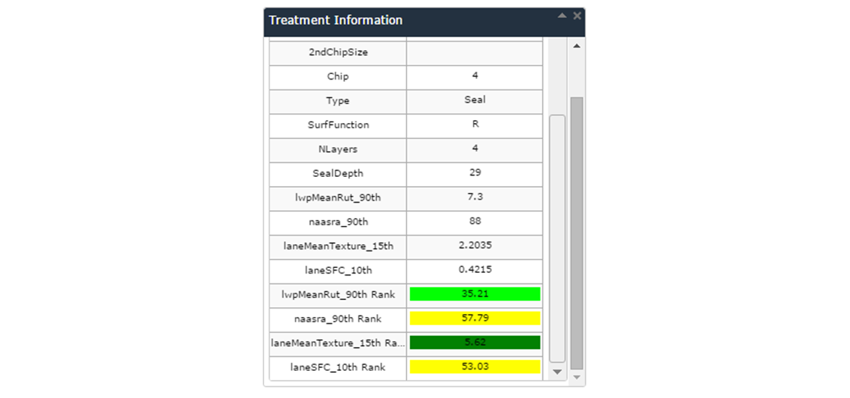
3. By exporting the FWP to the Field Inspection Tool (FIT), you can see the rankings automatically as part of the General Summary panel for the selected segment. It will look something like this:
Join Maintenance Data – not updated
The Join Maintenance Information into FWP feature, located on the FWP Management page under the FWP Tools, allows you to add historical maintenance information from your maintenance table into your Forward Works Program (FWP).
Maintenance data added in this way can be helpful to drive decisions during FWP-related office or field inspections, and can also be used as part of your deterioration model. For example, you may want to adjust the deterioration rate based on the quantity of maintenance required in the last or over previous years. This feature provides you with the functionality in a single click.
Based on your setup (see below) the feature can calculate the following and includes them as information columns in your FWP:
- info_maCostPerKMPerYr: Total maintenance cost per km per year over the selected analysis period
- info_maQtyPerKMPerYr: Total maintenance quantity per km per year over the selected analysis period
- info_maActySumPerKMPerYr: Total number of maintenance actions per km per year over the selected analysis period
- info_maActSum: Total number of maintenance actions over the selected analysis period
- info_maCostPerKMLastYr: Total maintenance cost per km over the last year only
- info_maQtyPerKMLastYr: Total maintenance quantity per km over the last year only
- info_maActySumPerKMLastYr: Total number of maintenance actions per km over the last year only
- info_maActSumLastYr: Total number of maintenance actions over the last year only
- info_maLastYrPercent: The percentage of the total maintenance action count over the analysis period that occurred in the last year alone.
- info_maYearsUsed: The number of years over which maintenance was added (specified in the XML setup, see below)
Note that costs and quantities will be scaled based on the percentage overlap that each maintenance action has with the treatment lengths. This means that if a maintenance action lies fully within a treatment length, then the full cost and quantity is added. However, if a maintenance action is longer than the treatment length or if it only overlaps partly with a treatment length, then the cost and quantity is scaled based on the percentage overlap relative to the full length of the maintenance action.
The feature is located part way down the FWP Management page. (If there are no setups available in the dropdown list, please contact Lonrix Support to add one for you).

You can edit or clone an existing maintenance setup by going to the Edit XML Setup page which you can access under the Manage Menu. Select the Custom class and Maintenance Join type to view the available setups which you can clone, rename and edit as needed.
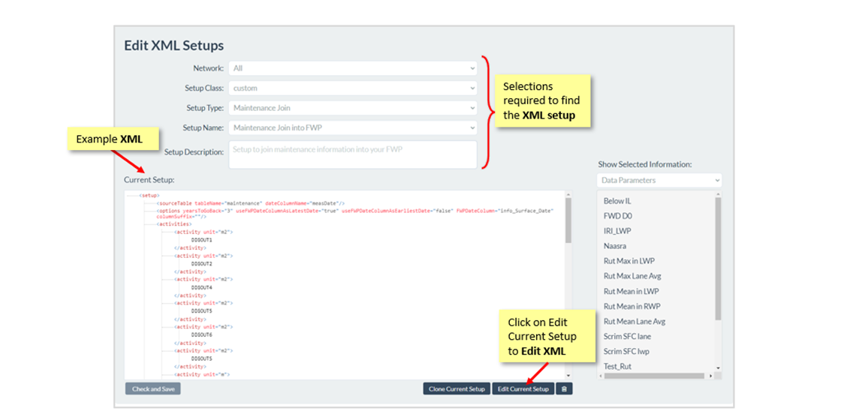
The attributes of the setup are provided in the image and details below:
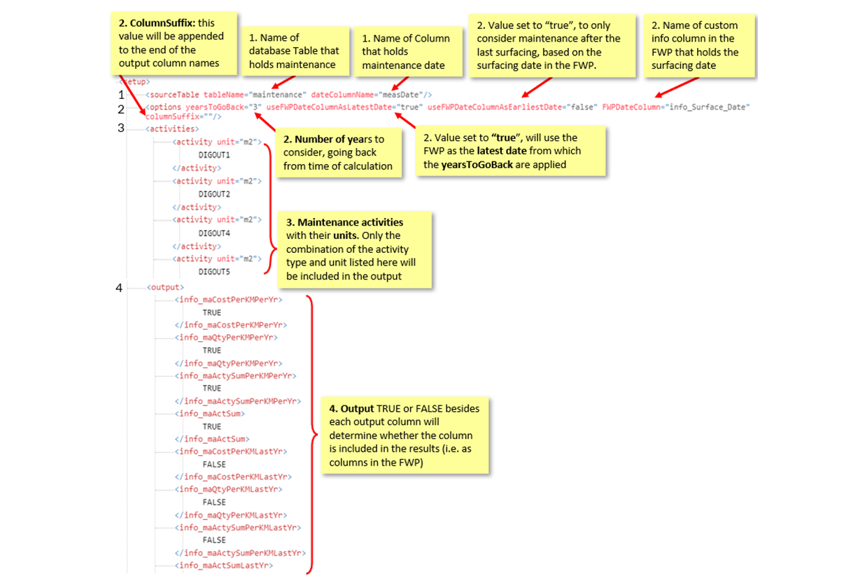
1) SourceTable: Identifies the table that holds maintenance data and the column that holds the maintenance date
2) Options: The following scenarios will help to explain the different options:
- Calculate maintenance results 15 years back from today: <... years to go back = "15" useFWPDateColumnAsLatestDate = "false" useFWPDateColumnAsEarliestDate = "false" FWPDateColumn = ""...>
- Calculate 15 years back OR until the date in info_SurfDate, whichever is less: <... years to go back = "15" useFWPDateColumnAsLatestDate = "false" useFWPDateColumnAsEarliestDate = "true" FWPDateColumn = "info_SurfDate"...
- Calculate 15 years back from the date in info_SurfDate: <... years to go back = "15" useFWPDateColumnAsLatestDate = "true" useFWPDateColumnAsEarliestDate = "false" FWPDateColumn = "info_SurfDate"...>
A columnSuffix can also be added to the output column names (e.g. info_maCostPerKMPerYr) which will enable you to run join setups with looking at different maintenance categories each with their own output columns (e.g. SU = Surfacing, PA = Pavement, DR = Drainage).
3) Activities: a list of the maintenance activities with their units
4) Outputs: the output is where all possible output columns are listed and TRUE or FALSE besides each output column will determine whether the column is included in the results (i.e. as columns in the FWP)
edited by Kiki on 1/16/2024
|